Pages

Redistricting: A Question and a Query

Wednesday, January 15, 2014
Alert: Both policy AND technology will be discussed below. Bring both your brains. You've been warned.
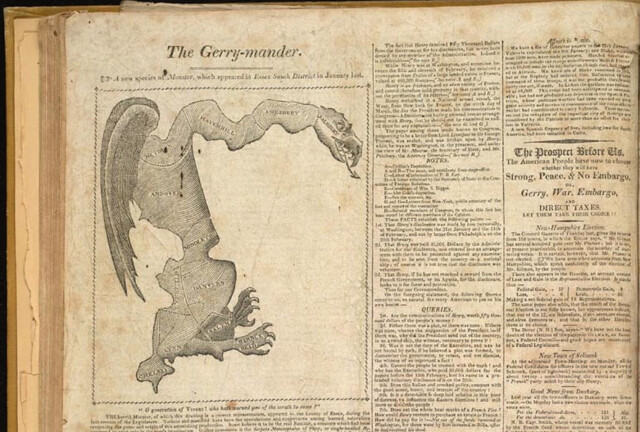
Gotta love the classics

The Question

My city is on the tail end of the country's redistricting cycle. Somehow while Texas was marginalizing Latinos and Dennis Kucinich was getting scribbled out of his constituency, we here in Burlington were waffling over how to deal with triparty politics and the implications of our changing neighborhoods.

I was unrealistic early on about how much of a role technology could play in the process. A survey of neighborhood geographic identity and a do-it-yourself redistricting app were helpful but not game-changing. After years of wrangling, the parties mostly just hashed it out in committee (though the final plan is derived from one made with our DistrictBuilder app), and now in about 6 weeks the voters will approve or reject it.

Which brings me to the question: What would the proposed plan change things for the average BTV citizen? It's a pretty easy one to answer in the aggregate - all the information is out there: new boundaries, old boundaries, population distribution, polling locations. But these bits are spread out across various sites and articles. What if there was a way to just ask the question: How will this change things for me?

Under the umbrella of CodeForBTV - the local CodeforAmerica brigade - I put together the basic answering tool. Built for phones (via Bootstrap), the app lets the user plug in their address and get back a list of redistricting plan implications:


The Query

The question of individual impact can be answered with a simple spatial query: return some pieces of information based on the polygons that intersect the user's location. This pointed to some basic building blocks:

  • The city redistricting plan - both the old wards and the new ones lumped into one geojson file
  • A robust search engine - I went with the Google Maps API because of the amazing viewport-biased geocoding and the built-in typeahead, but given more time I would use Leaflet and a state-hosted geocoder plus typeahead.js
  • Spatial query capability - fortunately CartoDB offers all the magic of PostGIS at a URL endpoint, with great styling available as well. 
The user-selected address gets converted to lat/lon, then sent to the CartoDB API in an ST_Intersects() query. It returns a map overlay of the old and new district boundaries at the site, and a set of answers to some FAQs about redistricting.

It's a simple app, relying on some robust APIs. I hope it's useful in getting my neighbors oriented to the landscape of the proposed redistricting. At the very least it'll save people some time peering at a large paper map in city hall, and at best it'll head off 40,000 individual "how will this affect me" emails directed at the city councilors and GIS manager.

I also hope it'll be of use to anyone else who wants to present geographic change over time at a user-selected location. Get the code on github.
Read more ...

On Reverse-Engineering a Map Stack

Saturday, January 11, 2014


I'm going to come right out and say this:

You should probably just use Mapbox.

How I came to that conclusion is a bit of a longer story.

The Scene

As a cartographer, I am an unabashed fan of Mapbox. I've been using Tilemill for years, and I love the fully-realized design of the Mapbox Streets basemaps. Even before Google Maps brought the paywall hammer down I was already migrating my clients' projects to the open-source ecosystem based out of a D.C. garage. Controlling so much of the stack in an open-source environment meant less risk to my clients, and in most cases it came out a lot cheaper. The choice was pretty easy, actually. 

Looking around this section of the market I don't believe that Mapbox and Google Maps have anyone to compete with but each other (mobile is another story). They are the only two companies currently offering a rigorous javascript API tightly integrated with attractive map services built for the web. (Debate this in the comments, ESRI, Nokia, and Bing users) There are plenty of a la carte options out there - Stamen's wonderful map tiles, the sheer power of the OpenLayers API - but as a lazy developer I've come to really like working with an integrated, open stack. Mapbox is my current choice, though many use cases all but require Google's services.

The Challenge

An open-source stack doesn't mean a free stack, and Mapbox's map tile charges can rack up quickly if you're not paying attention. Exhibit A: I offered Brandon Martin-Anderson one of my Mapbox tilesets to use as a reference for his Census Dotmap. Several viral weeks later I was looking at overages the size of my annual budget.

An open-source stack may not always be free, but in theory it can be copied and hosted by others. I've done this quite a bit on the javascript API side, mixing and matching tile providers with various client libraries. However, the costs that had begun to concern me were on the basemap end. So I set out to do what Mapbox flat-out encourages you to do with its wide-open codebase:

I would make and serve my own damn basemap. How hard could it be?

The Tools


I started with the open-source Tilemill template OSM-Bright, noting that there are some good examples of it in use out there. I grabbed the current OSM data, piped it into my local PostGIS database (note the hazards of adding many extracts) and spent some time turning it into "Geosprocket-Bright" in Tilemill:


Next came the heavy lifting. I exported a slew of regions to .mbtiles format; I would have loved to build a map of the entire world down to street zoom level, but I thought I'd start more realistically with a global map down to zoom level 9, then a handful of cities down to zoom level 17. I planned to put them on an Amazon S3 instance and tap them directly from the client library, doing an end-run around Mapbox hosting. Sounds pretty smooth, right?

Let's keep track of the time investment, shall we?

  • 4 hours to export everything from Tilemill
  • 6 hours to chop the .mbtiles into 1.6 million PNGs
  • 3 hours to consolidate them all into a single directory structure (because I was too dumb to do that in the last step)
  • 56 hours to push the tiles to an S3 bucket on a 20mbps connection
Obviously these are CPU hours, not billable hours - but it was still more than two days between when my map style was ready and when I could actually hook the map up to a browser.


The Verdict

This is a narrow case where I needed to roll my own tiles and serve them. My map included texture and custom fonts, which is beyond the reach of Mapbox Streets. The total filesize of my exports - even as .mbtiles - was 15GB; that translates to the Premium Mapbox hosting plan, and a whopping $6,000 flat fee per year. That's for five cities - the tiniest fraction of a world of tiles. It's not quite Google Maps Enterprise money, but damn. By contrast, it cost me nine bucks to get all of my map tiles into an S3 bucket, where I'll get billed something like half a cent per 1,000 map views.

But this process will be moot pretty soon anyway; the promise of Tilemill 2 is that you only need to bring your cartography to the table - Mapbox will do the rest of the work to get your style to the browser with vector tiles. They've only done this for a few testers while they're hashing out the details, but odds are there will be a public version in the first half of 2014. 

In keeping with other examples of open-source underpinning software-as-a-service, Mapbox has a sound business model. Despite the huge amount of intellectual capital they've open-sourced, it is still easier and - when time spent is considered - VASTLY cheaper to just use their hosted map services. I suspect they've been totally aware of this even as they release service-liberating tools like Tilemill, OSM-Bright and mbutil. The scale and efficiency of Mapbox make their hosted maps too good to avoid.

I hope my experience here has been instructive to others.

The Product

I did get a map out of my experiment, and it's free to use. If you happen to be mapping in Warsaw, Sochi, Santo Domingo, LA or the Bay Area, I hope it proves useful. Just use this XYZ tile scheme in your client implementation:

http://s3.amazonaws.com/geosprocket/tiles/{z}/{x}/{y}.png

As per the usual OSM license, be sure to include "© OpenStreetMap contributors". Happy Mapping!

Read more ...

The District Plows Tonight

Thursday, January 2, 2014
It will surprise no one in Vermont if I say it's cold tonight.
So I'm indoors, and bemused to note that it's also snowing down in the nation's capital, where such things tend to bring out the crazy in the more troglodyte-like elected representatives.

On the fun side, during the last storm in D.C. Jeremy Bowers of NPR wrote a handy script ("Mister Plow") to scrape location data for the city's plow fleet and offer it up as a live feed. Since this sort of screamed for a map, I built one, and now it can serve for this storm:


It's lacking a good temporal symbology, but it'll do to see if the plow has been by your street recently. The mechanism is Leaflet, Mapbox Satellite, and a dose of PHP to parse the feed. Grab it here if you dare.

I FOUND THEIR NEST! DEAR GOD, THE PLOWS ARE SWARMING!
Read more ...