Pages

Showing posts with label shapefile. Show all posts

Open Cadastral Data: a Github Test Case

Wednesday, July 24, 2013

A bolt of GIS-Manna from Heaven

A dedicated and talented GIS developer at the VT Agency of Natural Resources just finished compiling the most-comprehensive cadastral dataset to which our small state has ever had access. Coincidentally he sent out the announcement while I was annoying a few githubbers about their new geodata capabilities. What luck: a test case.

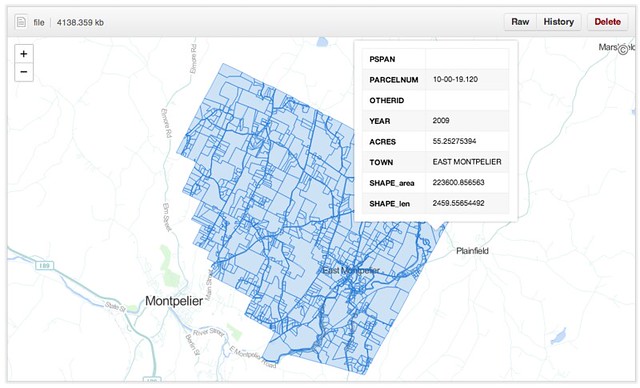
The dataset - as a shapefile - clocks in at 250MB, representing 289,000 parcel polygons in 191 towns. [The 46 VT towns not included tend to have populations under 200 and a blithe commitment to dusty paper records.] It turns out that this is over the 100MB limit imposed on individual files, so I pulled the dataset, split it by town and converted the outputs to geojson, then pushed them to a repository I just set up. The largest of these is juuuuust over the maximum file size to be renderable in Github's snazzy new Mapbox-based interactive maps, but most of the town parcel maps pop up just fine.

The Implications

Okay, great - another slippy map somewhere on the web. Who cares? These folks, actually:
  • A landowner who wants to look up the parcel numbers of her abutting properties without visiting the steam pipe distribution venue in the basement of her local town hall.
  • A town GIS manager who has a hard drive overflowing with parcel shapefiles, converted CAD drawings and map requests from lawyers.
  • Probably a lot of lawyers. Don't get me started.    
  • The overworked data gurus at the Vermont Center for Geographic Information (VCGI), who - while they're probably the only agency that can handle it - are really reluctant to take on management of a statewide, rolling, versioned database.

What Github provides in this test case, for free:
  • Fast hosting of modestly-large geospatial data
  • Relatively-simple version control of said data
  • Edit access to anyone with a github account and a GIS platform (FOSS or Arc'ed)
  • An embeddable client view for the public for files up to 10MB
  • A robust API for client views bigger than that (for example)
  • A muthaflippin' download button (well, "save page as")
For those of us who have been ranting about geoportals in recent months, this pretty much covers the bases. For free. Github is walking the #opendata walk.


What's Next . . .

There are a whole bunch of caveats here. Biggest is the file size issue (though I've seen Bill Dollins and Sophia Parafina starting to work around that in the past few days), since 10MB is a fine limit for municipalities in the second-smallest state, but Manhattan is a teensy bit bigger. Another hitch is data quality; this dataset is top-of-the-line, but like any other it's missing SPAN numbers, dates and acreages here and there. The vendors will tell you that quality can't be beefed up in a free collaborative environment, without data value-add. I don't know if they're right or wrong.

But I'd love to see a town GIS manager throw a pull request and get this ball rolling. Who's up for it?

The data hub is waiting right here


Update: 7/25/13
I've heard a bunch of awesome questions about the practicalities of using Github this way, so while I am by no means a power user I recorded a quick demo video.
Read more ...

Toward an Ideal Geoportal

Thursday, April 18, 2013

A Geoportal Identity Crisis

A city wants to open its geodata for public use. An NGO wants to spark a transparency initiative. A regional planning commission wants to stop emailing zipped shapefiles when pestered. They want to deliver two contrasting products - raw data and parsed themes - to as many as a dozen different audiences: policymakers, technical service providers, the press, professional curmudgeons, etc.

In the past decade, the solution to this nearly-impossible balancing act has been to build a Geoportal, and we've seen some pretty memorable misfires. Most of the trouble can be chalked up to the good intentions of the technicians who produce the data and the tools to distribute it; accustomed to a desktop GIS environment for exploration and analysis, they have built and re-built "GIS on the Web" (Chris Herwig documented his travels around a broad selection of them). They've done this under the assumption that users will be filtering, buffering, selecting by location and overlaying, and as it happens that's not really true. This approach fails all sectors of the public.

For many months now, Brian Timoney has been championing sanity in the wasteland of geoportals. He expertly trolls the mapjunk and the faustian UX, but he's also offered an analytics-based selection of "Best practices" for getting geodata to the public. Beyond how users actually interact with online maps, he's drawn attention to the subtle distinction between "open data" and "useable open data". But he is still something of a voice in the wilderness, as we all nod vigorously in agreement and go back to downloading file geodatabases from the USGS. We work with the system we have, because it's hard to envision the details of the alternative.

A Template

I've been trying to envision such an alternative, spurred on by some adventurous clients. Specifically, I wanted to see if it was possible to crack open a public dataset in a way that was compelling to technicians as well as to the lay public - something that would adhere to emerging best practices as well as to my own bias toward open architecture for open data. Timoney himself has already taken a stab at this, but we have different styles. So I cobbled together a template geoportal, wrapped around a standard multipurpose bit of public data: building records.

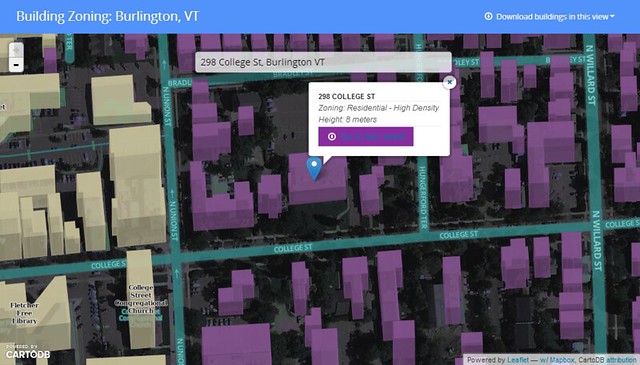
Give it a spin here.

I assumed two audiences: 1.) citizens who want their own zoning information and permit history fast, and 2.) analysts who want to grab bulk chunks of building footprint geodata for urban planning, disaster response or just noodling cartography. The former group can search for their address, see their building in context, and get the basic info before heading off to print their fact sheet. One minute or less.


The GIS specialists of the world can hit the download link and vacuum in all the features within the current view extent, in the interoperable format flavor that suits them (+TopoJSON for the bleeding-edge types).


This is just a page for a single dataset, but I think it meets the needs of both audiences and doesn't suck to look at or navigate. A few of the other features I wanted to include:
  • Lightweight and Javascript-based - less than 1MB before the tiles show up.
  • Shareable URLS - the root URL is subject specific, and the location hash allows users to pass around a focused view of a neighborhood or house.
  • Traditional search (in the hanging dialog box) is prominent without obscuring the map, since I'm of the opinion that a map is better as a page canvas than as a tiny sidebar window.
  • Very few visible bells and whistles - This is built to some narrow workflows with no mission creep and no toolbars. A bunch of info is socked away in a modal popup for the intrepid.
  • Cartography - I'm done with auto-pixelated graphics and bad default symbology; this is 2013 and we should all be using Mapnik for the web.
  • Open-source undercarriage - this is a combo of Bootstrap, Leaflet, CartoDB and Mapbox.
  • A note on CartoDB and Mapbox - their server code is legit open-source (meaning I could just run it my own damn self), but I've used their hosted services here since it's just - ack - easier to let them handle the services and flexibility thereof. And still cheaper than the competition. 
It's true that much of my requirements were about what to omit, but it is truly a difficult task to limit the scope of an application that is being driven to omni-functionality by stakeholders. Resistance is part of the process.

Here's the code on github. The index.html is commented liberally, so you should be able to tell where to swap things in and out. Scaling this approach to an entire suite of geodata could be as easy as forking the repo for every dataset you want to present to the public. Single-theme maps will see the most use in the long run, so keep it simple.

The To-Do List

This app needs typeahead in the search box to really deliver options. Andrew Hill at Vizzuality shows how easy this is when pulling from a CartoDB address column, but I'm still trying to bolt it onto the partially-abstracted leaflet geosearch module with my meager javascript skills. I will gleefully accept pull requests. Additionally, you may note that each building's "Fact Sheet" points to the same place. The city of Burlington is doing great things with its data, but we don't have building URLs keyed to parcel IDs or addresses yet :)

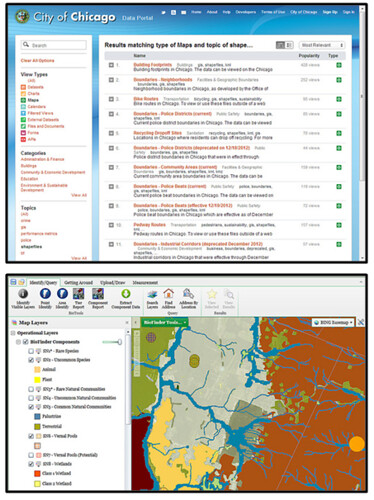
The bigger question is one of data discovery; if we're going to limit geoportals to one theme at a time, how do users get where they want to go? I hate being directed to a silverlight-slinging "Map Gallery" when I'm looking for info, but I'm not sure what the alternative is for top-level geodata search. Is it Chicago's spare text-based search? Is it the 300-button web GIS that requires training to use? Is it good SEO?

We know something about how users behave once they find the map they want, but how do we get them there in the first place?

Listocracy from Chicago, GIS-in-a-browser from VT Nat. Resources
Many thanks to Jay Appleton from the city of Burlington for being the single-handed support structure of open data here, including emailing the occasional zipped shapefile :)


Read more ...

TopoJSON and Messed-Up Topology

Tuesday, February 12, 2013


The awesomeness of Mike Bostock's TopoJSON format for geodata is not disputable. It drops file sizes by up to 90% and opens the door to seamless feature simplification. And Josh Livni's shpescape.com makes it accessible to everyone in a web conversion UI. But in the GIS world topology is a fearful thing - it blows up your geoprocessing when incorrect, and "fixing" the errors of features that partially share messy borders can take hours. So I wish the conversion of a messy feature set from .shp or GeoJSON to TopoJSON would magically erase the gaps and overlaps of topological suckage. Would that I could click my heels and make it so, along with a smoked porter appearing on my desk. 

The above example shows some postal codes at the U.S./Canada border; in 1816 some surveyor-deficient New Yorkers accidentally built a fort 3/4 of a mile into Canada, before realizing their mistake and abandoning it. If the current residents of zipcode 12979 decided they wanted to take that site back, the resulting overlap would be about what you see here, with a U.S. postal code overlapping a Canadian one. This being TopoJSON, the U.S. feature shares a D3 "path" with its New York neighbor. But its Northern border is now unique to that feature, no longer coinciding with the southern path of the Canadian feature it invaded. 

This doesn't really pose any showstopping problems in this use case, but it certainly could if the symbology were at all complicated or the label placement were important. My point here is that clean geometry still matters when using TopoJSON; errors don't go away when you make the conversion.

Fortunately it looks like more cleaning products are in the works . . .


Read more ...

The Buffalo in the Room Part 2: Fade Out

Sunday, September 16, 2012
In the last post we looked at the many difficult paths that can take us to the summit of cartographic nirvana known as the "Buffalo Tint", as rocked by National Geographic Maps and others

As I noted, this effect has traditionally been impossible to pull off in a GIS platform like ArcMap or QGIS. Tilemill initially got us a little bit closer by giving us full control over styling possibilities with CartoCSS code.

But now, as of Tilemill 0.10.0, compositing functions make this kind of effect a snap. Let's look at making a full Buffalo Fade, still using South Sudan as an example. Specifically, we're going to make a fade mask in Tilemill that can be laid over some Mapbox base layers in a web map.


Step 1: Preprocessing a Mask

This step - preprocessing in a GIS platform - is optional, it just depends on where you want the fade to begin. The purpose of preprocessing is to create a fixed feature mask;

  • QGIS: Run a buffer on your focal feature, larger than the convex hull of the feature for good measure. Then run a difference process between the buffer and the focal feature. 


Either way you're aiming for a feature mask that looks like this:


Step 2: Into Tilemill


Then import that feature mask into Tilemill and style it with what might be the most efficient piece of code I've ever cobbled together, compositing the feature mask to fade inward from its border:


[Alternately, in this case you can do it by just compositing every country that isn't South Sudan and eliminate the buffer processing above. Here's the CartoCSS to do that]

That's it. Export to MBTiles format and drop it on top of a base map of your choice. You're off to the races:


There are still a few bugs when using this for dynamic tiles, notably some tile-edge artifacts that break up the smoothness. But overall I'm looking forward to messing around with these new compositing capabilities


Read more ...

Shapefiles to Fusion Table Maps

Thursday, August 4, 2011
So you need a web map on the fly?


Google's fusion tables toolkit is something of a killer app for cartographers. As many have already discovered, it's sort of a miniature, compacted version of the process by which a relational database gets viewed as a web map. By tossing it all into the same browser-based, code-free blender, Google has removed a whole slew of otherwise-tedious steps from the process. Fusion tables can do the following:

  • Clean data
  • Serve data
  • Centralize authentication and access
  • Merge/Relate Datasets
  • Map and style geographic data
  • Serve maps on the web.
That's anywhere from three to six different types of software using traditional methods. Hot damn.

The one downside to fusion tables has been the use of KML as the standard accepted geometry type for complex features like lines and polygons. For those of us who work with the shapefile format, that's an extra step. Fortunately, Josh Livni at Google hacked together a way to send shapefiles directly to fusion tables with geometry intact for mapping:


It's a sweet add-on that lets you send - say - a shapefile showing Vermont towns directly to a styled web map, with queryable information via Google charts.

I love how this stuff just keeps getting easier . . .

Read more ...