Pages

Map Texture Studies

Tuesday, September 11, 2012
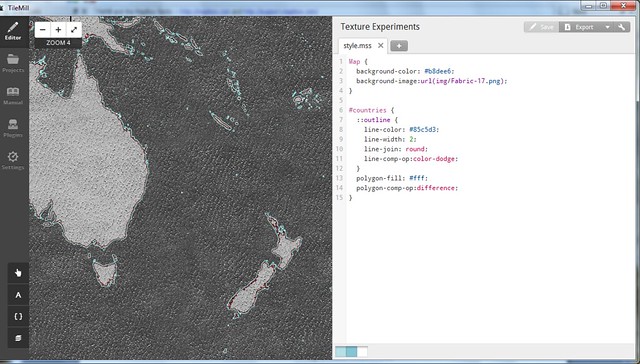
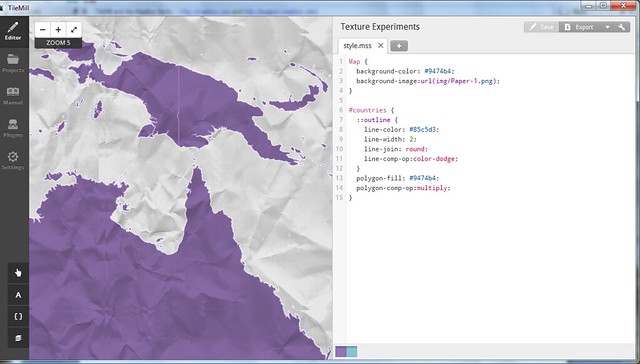
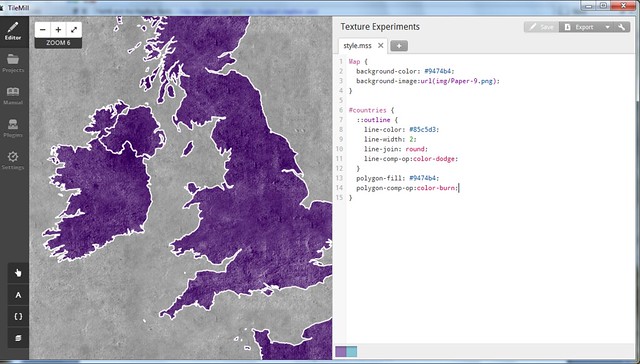
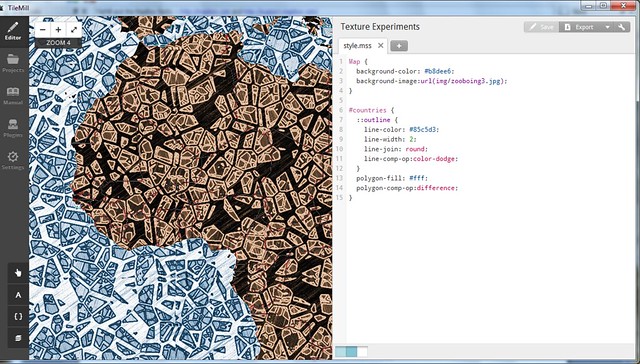
Given enough time to play with them, I'm coming to adore the new Mapnik image compositing features available in Tilemill. I'll cover some methods in more detail in the next few days, but for now here's a look at a series of map background textures, composited through geographic features. The vignettes below are displayed with their attendant carto parameters for your re-creative enjoyment. Click here to see the full set.


Many thanks to AJ Ashton for fiddling assistance and to Dane Springmeyer (+Artem & the Mapnik crew) for hacking the new features. [Mostly] seamless texture tiles generously provided by Dave McNally and Patrick Hoesly.

More compositing to follow . . .

Read more ...

The Official Takeover

Wednesday, August 29, 2012
High Seas by AJ Ashton. Pirate by Lego, clearly.
ESRI has made some interesting moves in the web mapping space in the past year. I don't blame them for being desperate to get a grappling hook up on a ship dominated by a combination of Google Maps and an open-source polyglot, but at this point the attitude is starting to border on dickish:

  • Step 1: ESRI rumbles toward a unified way of getting licenseholders' data online, while pulling a group of early innovators - GeoIQ - onboard to help. Admirable.
  • Step 2: ESRI adopts the term "Web Map" along with "Story Map" and a few other items that they clearly stole. No worries; a bit of rebranding and we're all one big-happy-web-mappy family, ESRI, Google, FOSS4G and your grandmother with her Bing API side project.
  • Step 3: ESRI kicks everyone else off the boat they just boarded. Now only ESRI makes "official" web maps, and clients should be wary of cut-rate imitators. Specifically a "Web Service" is only an ESRI REST service, and a "Web Map" is "[Like an] .mxd file, but for the web." 
Okay, this is an oversimplification - particularly that step 3 doesn't come from ESRI directly, but from a well-intentioned partner. Well-intentioned because the author clearly wants the "Average GIS professional" to have access to the brave new world of the cartointerwebs and that path is not currently an easy one. But this attitude doesn't arrive in a vacuum; ESRI has cultivated it in the hope that no one will notice they didn't innovate the web mapping space. Web developers did and still do. Folks from tiny open-source shops all the way up to search giants.

Fair play to the big guy with the marketing budget, you say. But here's why I want the developers that built this ship to retain control of it: THEY'RE BETTER AT IT. The user experience is uniformly superior in non-ESRI web maps, the implementation costs are lower and the data is faster. Though this will change and ESRI will catch up if new hires like Sean Gorman have anything to say about it.

But for now I would love to see a bit of humility and willingness to listen on the part of the GIS giant, instead of taking the ship by storm and kicking off everyone who knows how to steer it.
Read more ...

Data-Driven Symbology in Carto

Tuesday, August 7, 2012

The term "disruption" makes me want to stick a hot poker in my eyes, and then post a tilt-shifted instagram pic of that poker laying on a table next to a lychee mojito.

However, "disruption" is an accurate description of the state of cartography over the past two years or so. The traditional realm of the GIS analyst has been invaded and turned upside-down by an army of new cartographers who come from a software development background. These visigoths have brought odd notions like efficiency, economy and - heaven help us - design to the mapping field, but wow do they have a different process for making maps.

This dichotomy between GIS-er and carto-developer is visible in the CartoCSS language. Stemming from a project called Cascadenik, CartoCSS is a collection of stylesheet code that allows a mapper to assign symbology to geodata and render it with Mapnik - by far the best image rendering engine available for cartography. This code distinctly resembles the assemblage of rule sets, blocks and properties that any web developer would use to style a web page (hint: the target user base):

 #wind {    marker-width:5;    marker-fill:#DADDE2;    marker-line-color:#fff;    marker-fill-opacity: 0.6;   }  

The highest-profile deployment of CartoCSS is in the excellent Tilemill mapping platform from the folks at Development Seed. The code drives every style choice you make in Tilemill, then it compiles everything to Mapnik and delivers you exceptional graphics, both static and web-ready. This is great news for developers, who are already comfortable with code in their workflows. Not so much for the GIS analysts (like me) who have been Arc-trained for years on how to push buttons and move sliders in the quest for a good map. Also, CartoCSS has had limited functionality for thematic mapping - a common complaint is that you can't do multivariate symbology (graduated colors and symbols, say) without awkwardly-nested code cascades.

Until now, that is. A key development has been taking place behind the scenes, one style parameter at a time -- data-driven symbology has arrived in CartoCSS as of Tilemill version 0.10.0. Let's take a look at what this means:

Figure 1 - Marker Size
Previously, you needed to specify a hard number as a value for almost every style parameter. Translated, that means the point data (representing weather stations) in figure 1A was coded like this:

 #wind { marker-width:10; }  

To make graduated symbol sizes, you previously had to put in a plague of conditional statements over many lines, each pointing to a different value for marker width. Now you can just pull those numbers from attribute data; in figure 1B, the points are graduated based on average wind speed, with the values coming from the attribute field labeled "mph":

 #wind { marker-width:[mph]; }  

You can even manipulate the attribute-derived values directly in CartoCSS with basic math. In figure 1B, I've multiplied everything by 2 for an exaggerated effect. Things get interesting when you try styling on multiple variables - one on symbol width (wind speed) and one on symbol height (station elevation) in figure 2B:

Figure 2 - Multivariate Symbology

Label placement has long been the lone data-driven feature in CartoCSS. This code renders the weather station labels in figure 3A:

 #wind { text-name:"[STATION NAME]"; }  

Now you can orient labels directly from a column, for instance to make them point in the average wind direction in figure 3B below (fun but cartographically criminal). Makers of typographic maps should pop a celebratory beer over this one; a little bit of geoprocessing and your work is automated now. [Update: I'm told the real purpose of this is to orient interesting text characters like Arrows (-->). It's all fair game.]

 #wind { text-orientation:[direction]; }  

Figure 3 - Label Rotation

Building heights for "Pseudo-3D" effects can also now be pulled from attribute data. Figure 4A shows building outlines, 4B shows all buildings rendered with a height of 8pts, and 4C shows them rendered at actual height in meters with a vertical exaggeration of 2. Woot.
Figure 4 - Dynamic Building Heights

The possibilities are not limitless here. It takes a fair amount of chopping away at the Mapnik source code to enable each of these data-driven parameters, so the list of available ones is still pretty short. Nor does this make CartoCSS the absolutely-ideal entry platform for a GIS analyst looking to get into "Map Development". However, this represents a forward leap in ease of use for mappers of all stripes, and I look forward to seeing what the community can do with this functionality.

Read more ...

Results of the Geo Toolkit Poll 2012

Monday, July 23, 2012
Many thanks to everyone who participated in this survey of the geospatial industry. I tried to get a platform-agnostic look at the tools that are most-frequently used in our community, and after 250 responses I think we have a useful glimpse of the scene.

My reason for running this survey: I'm tired of speculating. As a multi-platform user I don't know where I stand with my clients and competitors, let alone in this sprawling industry, and I've heard lots of similar curiosity from colleagues. I call this an independent survey in that no vendor funded it (nobody funded it, actually) and it isn't for marketing use. This is a community poll, nothing more. Onward . . .

Methods

This is worth a cursory glance, since the results are inevitably colored by the collection routine. I relied almost entirely on social media to get the word out, specifically:
  • Numerous twitter solicitations to my ~500 followers, retweeted to a combined audience of over 11,000 utilizing hashtags for both the ESRI User Conference and OSCon - probably annoying the crap out of everyone in the process
  • Google+ and Facebook posts
  • Listserv posts to ESRI, OSGeo, OSM and Google user groups
  • Posts on the three largest geospatial groups on LinkedIn
Given the warren-like distribution network, I do not know how many people saw this poll. Thus the sample size is 250 out of an unknown population, and no big-picture conclusions should be drawn. Also let it be known that the balance - even if measured properly - changes from month-to-month.

Results


Question 1: Which of the following geospatial technologies have you used on at least one project in the past year? [Note - I Included pre-purchase GeoCommons on its own out of morbid curiosity; I otherwise would have included it with FOSS4G Web Tools]

Some of the technologies that went into the "Other" column include FME, MicroStation, ENVI/IDL, GIS Cloud, AutoDesk, Maptitude, Idrisi, ERDAS, MapProxy, R-Spatial, Garmin Basecamp, Oracle XE, Ushahidi and Geocortex. Sorry to have ignored those, but it's a big ecosystem out there.


Question 2: Which of the above technologies did you use most frequently in the past year?


Platform Gregariousness: Do you cross over from your primary platform? e.g. ESRI is your main platform but you've also used Google Maps/Earth at least once in the past year. [A venn diagram would be cooler but the chart API was inscrutable]


Use by Business Sector:


Use by Country: (Click here for fullscreen glory - we're all cartographers here)


There's a lot to see in these distributions - an ESRI lean among U.S. respondents, a FOSS4G lean among Europeans. Also interesting to see how the sectors use these tools. See anything of note? Anything obviously-spurious? Do tell - I think there's a good discussion to be had here.

I'll say it again: this was not a scientific, controlled survey. It's a snapshot or an anectodal collection; take your pick. But it is nonetheless interesting to see what this group of mappers uses to get the job done. Thanks again to you all for pitching in, and maybe we'll try an expanded version next year.

If you're interested in the raw, messy results (stripped of unique identifiers of course), hit this link for an XLS download, and happy parsing!


Read more ...

GeoTools 2012 Poll - Round 2

Monday, July 23, 2012
Expanding the search around the Geo Community:

Read more ...

Results of the Geospatial Technology Users' Poll 2012

Friday, July 20, 2012
Update 7/23/12:  The poll is now reopened and live results are appearing at a new post. The figures and discussion below should be considered preliminary

Thanks to all those who hit yesterday's poll of technologies at work in the geospatial field. I've got some interesting results below.

First a note on experimental design: This crap is not scientific. First I tweeted, facebook-posted and Google+'d, so I got in contact with the core community of geogeeks with whom I regularly interact. Then I sent it out via the Vermont GIS listserv, the ESRI user conference hashtag and the O'Reilly open-source conference hashtag, hoping for balance. There is surely a geographic skew toward the U.S. Northeast, but I'm pleased with the general distribution of respondents. n = 117, which seems pretty good to me. Hit me on Twitter or on the GeoSprocket contact page if you'd like a copy of the raw survey results.

Here's a look at the participants using the generalized locations of reported companies/institutions (lots were left blank, so who knows):


The results of question 1:

Note: Some of the technologies that went into the "Other" column include FME, MicroStation, ENVI/IDL, GIS Cloud, AutoDesk, Maptitude, Idrisi, Mapserver and Geocortex. Sorry to have ignored those, but it's a big ecosystem out there.

And the results of question 2:
Ayup, ESRI Desktop is the big winner in this circle. But a surprising number of Google Maps folks there too. Also intriguing is the even split among the open-source toolset types, contrasting with the topheavy ESRI lean toward desktop.

Here is primary toolset use by overarching category:


Things get interesting when we parse out some conditional results:
  • 40% of users whose primary tool is an ESRI product have also used an open-source geo platform in the past year.
  • But a whopping 80% of users whose primary tool is open-source (desktop, web or DB) have also used an ESRI product in the past year.
  • Same with Google - 80% of respondents who primarily use Google Maps have also used an ESRI product in the past year.
  • That favor is largely returned - 75% of primary-ESRI users have used Google Maps.
  • OpenStreetmap and GeoCommons had plenty of casual users, but very few used them/built them as their primary tool (1% each).
      There's a venn diagram to be had in there somewhere, but I'm not up to it.

Without leaping to conclusions, I would say that it's still an ESRI world. Even the folks whose day-to-day revolves around open-source or Google tools still fire up an Arc license every now and then. The converse is not equivalent; fewer than half of ArcJockeys use any of the open-source tools, though they are partial to Google Maps.

There are a lot of potential reasons for that, but it seems safe to say that open-source geo is still developers' territory, and Google mapmaking tools are more comfortable ground for ESRI's users. I recall that specific path when I was making my own way from ArcGIS to GDAL and Javascript.

There's a lot to read here; what are your thoughts? Anything surprising?


Read more ...

Geo Users and Developers Poll, 2012

Thursday, July 19, 2012
Thanks for your round 1 responses! Round 2 is live now at this page.

It seems like the right time to get a community pulse on the use of various geospatial technologies. Please choose items whether you've worked to develop the tools themselves or used them on the client end. There is some inevitable overlap between categories, but use your best judgement.

I'll put the results up in the next blog post. Thanks for participating.

Read more ...

Open Source, Open Data, Open For Business.

Tuesday, July 10, 2012
GeoIQ and an Origin Tale


In 2009 I was a "GIS Technician". Heaven help me, I was auto-completing polygons on good days and schema locking on bad ones, at a well-meaning but projection-free engineering firm with 300 AutoDesk licenses and 5 ArcEditor seats. It was the worst of times.

Early on that year I took a week off to go to Las Vegas with my wife, who was presenting at the AAG conference there (she's the brains of the outfit). Benefiting from the super-low "Spouse" attendance fee (academic geographers take note), I wandered from one cool session to another, my brain stimulated in new and exciting ways. I watched in a standing-room only crowd as Jack Dangermond explained how mashups (remember those?) were going to solve Africa's problems, and I saw my first demonstrations of Object-Oriented Image Analysis and Hyperspectral wetlands detection. Cool enough, but there was something disheartening about the fact that 95% of the map crunching I saw was being done by ESRI products.

On a whim, I went to a panel session called "Open Source GIS". Probably for the damn novelty of it, but also maybe due to some lingering frustration from being license-bound while trying to do mapping work in my peace corps years. The little room was about 3/4 full and the panel consisted of some folks from USGS who used GRASS and PostGIS, and also an animated fellow named Andrew Turner from FortiusOne, who had a few things to say.

The Open Source GIS Panel at AAG 2009. Note the overdressed gentleman about to drop some science on us. (Photo courtesy of  Shriram  Ilavajhala)
It was no great conversion moment. The session covered some pretty wonky stuff from the perspective of a button-clicking non-coder, though the enthusiasm was palpable in the audience. The real "Glitch in the Matrix" hit when I talked with Andrew after the session. In an information stream that challenged the human limits of spoken words per minute, he told me it might be helpful if I downloaded Quantum GIS (1.3, yo.) and took a look at GeoCommons.com. Back at my computer, the world opened up to me; this was the starting event that would lead to the creation of Geosprocket a year later, and for that I am eternally grateful.

An early, misguided attempt to use GeoCommons in mapping global coffee production. Things have gotten better.
In that session and in subsequent interactions, Andrew conveyed two motivations for his work with FortiusOne-thence-GeoIQ.
  1. Open Source: OS software is just the tip of the iceberg. It fosters a culture of innovation and robustly supports the tools that people want most.
  2. Open Data: Geographic information should be a public good (Geo"Commons" - Get it?), and we can all benefit from driving maps into the public sphere.
These drivers were not unique to GeoIQ; they are dear to many in our community. Over time I have adopted these and included them in the core of Geosprocket's mission. As such it was something of a body blow this morning to read the news that GeoIQ had been purchased by ESRI. The pundits have already weighed in eloquently on this deal, and I can't add any new market analysis. I've even run out of snark. I can only mourn a bit to see GeoIQ forced to choose between open source and open data, for they have surely chosen the latter.

I have no doubt that ESRI's resources will supercharge GeoIQ's pursuit of open data. If Jack and co. have the wisdom to scrap ArcGIS Online and replace it with "ArcIQ" the world will be a better-informed place. But I'm going to miss the code contributions of some talented individuals. I raise a glass to them for getting me started in this business.


Read more ...