tl;dr
There's no citywide relationship between crime rate and elevation in San Francisco. It's because there are other factors at work - like property value, income, tourism, etc. - in between the two. But there are a few discrete spots around the downtown area where it is at least partially accurate to say "Crime doesn't climb" - check out the last map on this page.Crime Doesn't What?
Dammit, I love hexbins. I love their flow complexity, I love their visual appeal, I defend them where necessary, and I use them wherever I can. However, sometimes hexbins don't tell the whole story.Last week a couple of talented Bay Area developers put some of San Francisco's new open data to use, testing the old adage that "Crime Doesn't Climb" in the city. They compiled SFPD crime statistics in elevation-based strata and found - indeed - that the lion's share of SanFranCrime occurs closest to sea level. Recognizing a bit of simplicity in this argument, they went a step further and adjusted the numbers to account for the fact that there is simply more space - more crime-canvas, if you will - at lower elevations. The results were the same: lots of crime low, not much up high.
The web reacted with characteristic nuance and reason:


Because at it's heart, this analysis has already been critiqued by Randall Munroe:

Crime occurs where people - perpetrators and victims - are already concentrated. As such, any explanation of when/where/why has to account for population.
Population
The best level of detail available on population is the U.S. Census block. In a city as big as San Francisco, there are thousands of these, each with a very credible population count. They're not as spatially consistent as hexbins, but they're accurate:Elevation
Elevation variation also contributes to the city's distinct character:Crime
And the frequency of crime seems to reflect a bit of both population and elevation:Crime Rate
This is colinearity at work. Crime doesn't climb because people don't climb (at least not in SF). When we account for population, the relationship between crime frequency and elevation gets a lot shakier. The signal flattens, overtaken by noise:In particular, the relationship seems flat everywhere but downtown and a few outlying blocks. And with a wild stab I'd suggest that the downtown standout effect is the result of uncounted populations: the tourists and commuters.
And here's what that looks like as a linear regression with block elevation:
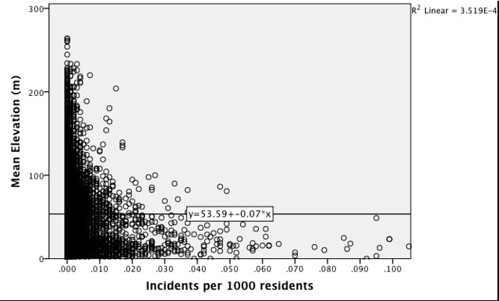
There's certainly a pattern, but there's no model fit because the overwhelming majority of the city's blocks are relatively low-elevation, with a low crime rate.
So can we draw any conclusions about elevation and crime in San Francisco? Perhaps. What the above data tells us is that the relationship between crime rate and elevation isn't uniformly applicable across the city. That doesn't mean that the relationship doesn't hold in some spots, though. To figure out where, we turn to Geographically-Weighted Regression (GWR) - a tool that helps to account for spatial variation in explanatory relationships like this one.
Where Crime Doesn't Climb
There are hotspots where the model fit struggles to reach an R^2 of 0.06, but for most of the city the relationship doesn't hold. However, there's one more thing we can check: local model significance:
And this is where we see the signal come through: in Downtown, the Financial District and parts of North Beach and SoMa, subtle variations in elevation have a bit of explanatory power for patterns of the crime rate. But I should stress again that the model fit is still weak. This is - at best - an extremely complex relationship, and GWR can only show us areas where that complexity has a consistent character.
No comments:
Post a Comment