Pages

Showing posts with label GeoIQ. Show all posts

Context For Cheap - The Map Reference Overlay

Wednesday, January 23, 2013
I used to hate building reference layers in my maps. Labeling placenames was painful, but nothing compared to the chest-hair-waxing misery of scaling transportation symbology by road class. No out-of-the-box defaults were ever cartographically pleasing, and hours were incinerated in the fires of annotation placement. [Sorry, QGIS and Illustrator - you're just as much to blame here as the Redlands upstart.]

But that's basically all in the past. Not long after I slogged my way into web interactive maps, the crew at Mapbox released the finest preconfigured basemap I've ever seen, "Mapbox Streets". They quickly followed with a dozen attractive starter styles and an impressive customization pallette.
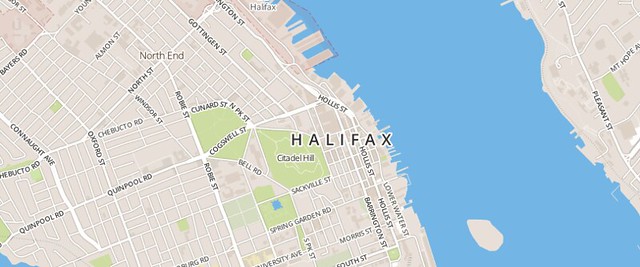
Mapbox Streets

The idea of the pre-baked map was nothing new - Google, ESRI, GeoIQ and others had entered the web map age with variations on the Reference-Canvas idea: "You provide the overlay data and the story to tell, we'll provide the geographic context." And this works really well for monodimensional Point of Interest (POI) data, as demonstrated by the Google pushpins that these days rain from the sky to skewer every interesting set of coordinates on the planet. Pins and icons don't get in the way of labels and reference features.
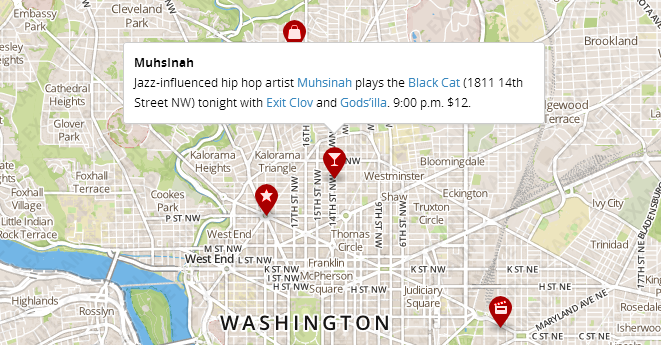
The siren call of the martini glass . . .

But what about polygons and the world of the choropleth? Not that it stopped anyone from trying, but polygons on top of a reference canvas either obscure the features beneath or require too much transparency to make a thematic point. I bombed out on early attempts to work with this essential truth:
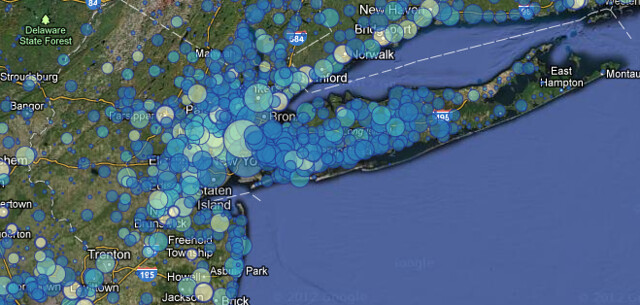
NYC Metro, covered in bubble bath

The solution to this problem is under our noses. I first noticed this technique when John Keefe and Steven Melendez at the WNYC Data Desk posted a Mapbox-based interactive looking at NYC's proposed wards; the streets were curiously visible above the color-coded ward polygons.

They had introduced me to the reference overlay.

Leveraging the customization options of Mapbox streets, they had
  • Winnowed out the layers representing land and water from their basemap, leaving just roads, land use and text,
  • Set these to a modestly transparent level (maybe 30-40%),
  • Using the compositing of the Mapbox API, laid this semi-transparent layer on top of the thematic polygon layer, inverting the standard reference canvas model
After I recovered the pieces of my brain that had exploded out my ears (maybe I'm easily impressed), I set to applying this tactic to my own maps. I also realized that this could be expanded to allow for a sort of map sandwich, with land and water below, thematic data next and reference data on top:


And it's not just a Mapbox thing:
Hell, if you can do better than AJ Ashton and company, build your own mostly-transparent reference overlay and cache it in a tile server for future projects.

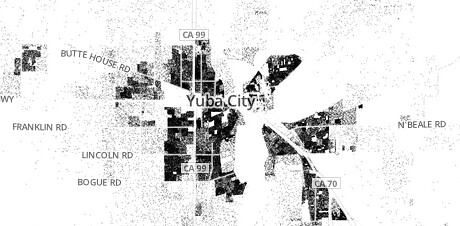
Subtle Context on the Census Dotmap

While I realize this is all old hat in the GIS world (yes, of course you place your labels above your polygons dude), it's usefulness in web mapping can't be overstated. The reference overlay saves us serious time, solves the "mashup" problem, and lets us focus on our data and what it has to say.

Update, Wednesday Night:
After conversations with some of the Stamen and former-GeoIQ folks, I figured it'd be worth comparing what happens when three different teams build reference overlays from the same (OpenStreetmap) data. Check it out here.


Read more ...

The Official Takeover

Wednesday, August 29, 2012
High Seas by AJ Ashton. Pirate by Lego, clearly.
ESRI has made some interesting moves in the web mapping space in the past year. I don't blame them for being desperate to get a grappling hook up on a ship dominated by a combination of Google Maps and an open-source polyglot, but at this point the attitude is starting to border on dickish:

  • Step 1: ESRI rumbles toward a unified way of getting licenseholders' data online, while pulling a group of early innovators - GeoIQ - onboard to help. Admirable.
  • Step 2: ESRI adopts the term "Web Map" along with "Story Map" and a few other items that they clearly stole. No worries; a bit of rebranding and we're all one big-happy-web-mappy family, ESRI, Google, FOSS4G and your grandmother with her Bing API side project.
  • Step 3: ESRI kicks everyone else off the boat they just boarded. Now only ESRI makes "official" web maps, and clients should be wary of cut-rate imitators. Specifically a "Web Service" is only an ESRI REST service, and a "Web Map" is "[Like an] .mxd file, but for the web." 
Okay, this is an oversimplification - particularly that step 3 doesn't come from ESRI directly, but from a well-intentioned partner. Well-intentioned because the author clearly wants the "Average GIS professional" to have access to the brave new world of the cartointerwebs and that path is not currently an easy one. But this attitude doesn't arrive in a vacuum; ESRI has cultivated it in the hope that no one will notice they didn't innovate the web mapping space. Web developers did and still do. Folks from tiny open-source shops all the way up to search giants.

Fair play to the big guy with the marketing budget, you say. But here's why I want the developers that built this ship to retain control of it: THEY'RE BETTER AT IT. The user experience is uniformly superior in non-ESRI web maps, the implementation costs are lower and the data is faster. Though this will change and ESRI will catch up if new hires like Sean Gorman have anything to say about it.

But for now I would love to see a bit of humility and willingness to listen on the part of the GIS giant, instead of taking the ship by storm and kicking off everyone who knows how to steer it.
Read more ...

Open Source, Open Data, Open For Business.

Tuesday, July 10, 2012
GeoIQ and an Origin Tale


In 2009 I was a "GIS Technician". Heaven help me, I was auto-completing polygons on good days and schema locking on bad ones, at a well-meaning but projection-free engineering firm with 300 AutoDesk licenses and 5 ArcEditor seats. It was the worst of times.

Early on that year I took a week off to go to Las Vegas with my wife, who was presenting at the AAG conference there (she's the brains of the outfit). Benefiting from the super-low "Spouse" attendance fee (academic geographers take note), I wandered from one cool session to another, my brain stimulated in new and exciting ways. I watched in a standing-room only crowd as Jack Dangermond explained how mashups (remember those?) were going to solve Africa's problems, and I saw my first demonstrations of Object-Oriented Image Analysis and Hyperspectral wetlands detection. Cool enough, but there was something disheartening about the fact that 95% of the map crunching I saw was being done by ESRI products.

On a whim, I went to a panel session called "Open Source GIS". Probably for the damn novelty of it, but also maybe due to some lingering frustration from being license-bound while trying to do mapping work in my peace corps years. The little room was about 3/4 full and the panel consisted of some folks from USGS who used GRASS and PostGIS, and also an animated fellow named Andrew Turner from FortiusOne, who had a few things to say.

The Open Source GIS Panel at AAG 2009. Note the overdressed gentleman about to drop some science on us. (Photo courtesy of  Shriram  Ilavajhala)
It was no great conversion moment. The session covered some pretty wonky stuff from the perspective of a button-clicking non-coder, though the enthusiasm was palpable in the audience. The real "Glitch in the Matrix" hit when I talked with Andrew after the session. In an information stream that challenged the human limits of spoken words per minute, he told me it might be helpful if I downloaded Quantum GIS (1.3, yo.) and took a look at GeoCommons.com. Back at my computer, the world opened up to me; this was the starting event that would lead to the creation of Geosprocket a year later, and for that I am eternally grateful.

An early, misguided attempt to use GeoCommons in mapping global coffee production. Things have gotten better.
In that session and in subsequent interactions, Andrew conveyed two motivations for his work with FortiusOne-thence-GeoIQ.
  1. Open Source: OS software is just the tip of the iceberg. It fosters a culture of innovation and robustly supports the tools that people want most.
  2. Open Data: Geographic information should be a public good (Geo"Commons" - Get it?), and we can all benefit from driving maps into the public sphere.
These drivers were not unique to GeoIQ; they are dear to many in our community. Over time I have adopted these and included them in the core of Geosprocket's mission. As such it was something of a body blow this morning to read the news that GeoIQ had been purchased by ESRI. The pundits have already weighed in eloquently on this deal, and I can't add any new market analysis. I've even run out of snark. I can only mourn a bit to see GeoIQ forced to choose between open source and open data, for they have surely chosen the latter.

I have no doubt that ESRI's resources will supercharge GeoIQ's pursuit of open data. If Jack and co. have the wisdom to scrap ArcGIS Online and replace it with "ArcIQ" the world will be a better-informed place. But I'm going to miss the code contributions of some talented individuals. I raise a glass to them for getting me started in this business.


Read more ...

Browser Cartography: Some Safehouses for ESRI Refugees

Wednesday, May 30, 2012
"Island" by Konstantin Kafer

A Primer for Getting Started With Open-Source Web Maps


Now that you know why I care about telling compelling stories with widely-distributed maps, let's look at a few of the many tools that are out there to help the process. I confess to narrow experience here; I use MapBox and CartoDB for the majority of my projects, and there are plenty of alternatives to those. But as a starting point I think that these open-source web map design platforms are perfect - they minimize the amount of code required, they use the best graphic rendering engine in the field, and they are extremely cheap (or free) to use, even in an enterprise or high-traffic environment. I'm avoiding ESRI's "ArcWhatever Online for Server" options because of a.) the high price tag, and b.) the actual user-facing sites are only as robust as the javascript or flash developer who builds them. My preferred options give you a lot more to work with out of the box, for free.

I am not going to walk you step-by-step through the process below - I'll point you to resources that will - but rather I mean to sketch the structure that can get your map applications up and running. If you're stumbling and need some help, drop me a line through the GeoSprocket contact page or on Twitter

Step 1: Data


Data in this context can mean a lot of different things. The tools we're using aren't picky, so this includes:

  • Shapefiles (but this will need to be in a compressed folder)
  • Spreadsheets (CSV, XLS, DBF, you name it)
  • KML or KMZ
  • GPX or in many cases raw text from various GPS units

Desktop GIS isn't dead. Those who say so aren't paying attention. You still need some form of spatial data manipulator to analyze and prepare your source information, and if you can do that with pure GDAL hacking at the command line of a virtual machine, you have no need for my advice. Yes, "Desktop Platform" includes ArcMap, but if you want to make a clean break I recommend Quantum GIS for robust, open-source geoprocessing potential.


Step 2: Choose a Platform and Get a Hosting Account

Your data should live on the web somewhere - where, exactly?
  • Option 1: MapBox - Most advantageous for its speed and complete cartographic design potential. However, once you've rendered your map into tiles (in step 3), there's not much you can do to change them on the fly. Use this option if you have a specific vision of symbology in mind to present to your users, if you have a lot of information to present interactively (i.e. text/charts/images that pop up when a feature is clicked), and also if the underlying data will be accurate for more than a few weeks. Sign up here for the free starter account.
  • Option 2: CartoDB - This is a user-friendly, cloud-based adaptation of the popular PostGIS database architecture. It can run a bit slower than MapBox (since it's rendering on the go), and the cartography options are more limited. However, the provided SQL API means that you can sort, filter and process your data basically in the browser. Go with this option if your application will have a lot of user-generated queries (i.e. "how many points are within 50 miles of this one?"), or if you regularly update the data being mapped. Sign up here for the free starter account (notice the pattern of freeness).


Step 3: Mapping Your Data


At this point using either option, you should now have maps that are ready to be launched.

Step 4: Serving Your Map to the World


Step 4a: Embedding - By far the easiest way to get a URL that you can distribute to your audience. Both Mapbox and Cartodb have fantastically-easy embed interfaces for plugging maps into your blog or website content management system, and in each case they essentially host a full-page map website for you as well. Examples:


Racial Breakdown of Census Blocks in Burlington, VT Using Mapbox


Participatory Farm Mapping in Vermont with CartoDB


Step 4b: The World of Pages, Javascript and Beyond - This creeps a bit further beyond the scope of what I hope to cover here, but this is the ultimate destination for most of my map applications. There is simply greater flexibility in a website or mobile application that you can manage yourself, though it requires some knowledge of HTML, CSS and Javascript.

I say "some" knowledge - I didn't know the first thing about code when I got into this world, but it was amazing how easy it was to adapt a little bit. The resources available in the open-source software community are spectacular; the help and guidance offered to me by experienced developers out of sheer goodwill has been uniformly superior to the high-priced support of proprietary vendors (Trimble and ESRI, I'm looking at you). I am no developer, but with community help I've been able to explore and utilize some of the most exciting tools available to cartographers in our time. And things are only getting better from here . . .

Here are a smattering of places to start for customizing a page of your own:

  • Mapbox Templates - these require a bit of github knowledge, but otherwise they are as close to plug-and-play map sites as you'll find. 
  • CartoDB Examples - Plenty of code available for re-purposing and adapting. In many cases this just involves changing a line or two to point to your own data.
  • Codecademy - Might as well learn how to do this stuff for real . . .


Read more ...