Pages

Showing posts with label github. Show all posts

The District Plows Tonight

Thursday, January 2, 2014
It will surprise no one in Vermont if I say it's cold tonight.
So I'm indoors, and bemused to note that it's also snowing down in the nation's capital, where such things tend to bring out the crazy in the more troglodyte-like elected representatives.

On the fun side, during the last storm in D.C. Jeremy Bowers of NPR wrote a handy script ("Mister Plow") to scrape location data for the city's plow fleet and offer it up as a live feed. Since this sort of screamed for a map, I built one, and now it can serve for this storm:


It's lacking a good temporal symbology, but it'll do to see if the plow has been by your street recently. The mechanism is Leaflet, Mapbox Satellite, and a dose of PHP to parse the feed. Grab it here if you dare.

I FOUND THEIR NEST! DEAR GOD, THE PLOWS ARE SWARMING!
Read more ...

How to build a Mobile-First Map Form

Friday, November 8, 2013

Find me, small screen.

I've spent a lot of time thinking about the incredibly rich experiences we're getting these days from a digital map paradigm basically invented by Google in 2005.

A rich experience everywhere but on mobile devices, that is.

The dichotomy is pretty intense - on our larger screens, we have data visualizations of artful grandeur. We have amazing cartography in tiles and vectors, and we have smooth analytical tools. We're even approaching "GIS on the Web" that doesn't suck.

But then you turn on your phone and the best applications use oblique-angle maps the same way they did in Car SatNavs a decade ago.

I don't have an answer to this problem, I just mean to say I've been thinking about it. And it turns out that a bunch of the technologies I use regularly can be pretty easily combined to offer some possible fixes for how a user experiences maps on mobile. I'll walk you through them while trying to tackle a basic application: a location-based survey.

1.) Bootstrap

I get it. I overuse Bootstrap for the architecture of my sites. But in the latest release (3.0) they went "Mobile First", so it makes many of my other tasks easy by providing the responsive classes out of the box:


2.) Google Forms

I still think of Google Forms as an underutilized gem for easy data collection: pipe data from a form to a spreadsheet with an API; one barely needs to try anymore :) However, tying a custom Bootstrap page to a specific google form requires a few things available in the source code of the input form's page:
  • Form identifiers:
  • Field-specific IDs:
  • A Redirection iframe:


3.) Mapbox.js

Most of the necessary functions here are actually native to Leaflet, but I like the look of the Mapbox implementation, and they provide "Retina Tiles" that scale better for mobile. The basic tasks for the map in this application are:
  • Figure out user location without asking
  • Let the user fix the inevitably-incorrect positioning
This works with a quick call to a free IP registry, centering the map on the result:


Then the user can drag the map around under the crosshair to where they actually are - this is a tactic I borrowed from OpenPlans after I got a reminder:


4.) CartoDB

Using a new tool they've made available to sync tables, there's almost no code involved in this step. All I needed to do was go to "File-->Publish" in the form target spreadsheet, then copy the .csv URL into the "New Table" creation dialog in CartoDB. Then a bit of easy styling created a custom-mapped results page:


The page itself is pretty simple, and you can grab it as a gist here. It'd be pretty easy to fork it and replace the form parameters with one of your own. As always, please share if you use it; I'd love to see where others take this.

The Caveats and Alternatives:

  • Geolocation by IP is pretty awful, unless you happen to be Google (but in that case you're currently being sued for the method by which you collected your registry). The service I used put me in the correct city on my laptop, the correct state on my tablet, but according to my phone I'm in Buffalo. There are better ways to get location, but they require user permission, which is a UX hurdle I didn't want to jump for this.
  • I subscribe to the gospel of responsive design because I'm lazy. It would probably be smoother to build this as a native Android/iOS app, but no way would it be this easy.
  • Since location is being passed to the table from the initial map, there's no geocoding and you could theoretically just tap the Google Drive API to put points on a results map. But again: EASY. CartoDB is that :)

#Facepalm

In the first run I forgot the mobile-specific meta tag. I was reminded :) Thanks, Vladimir!


Read more ...

5 Reference Recipes

Thursday, October 17, 2013


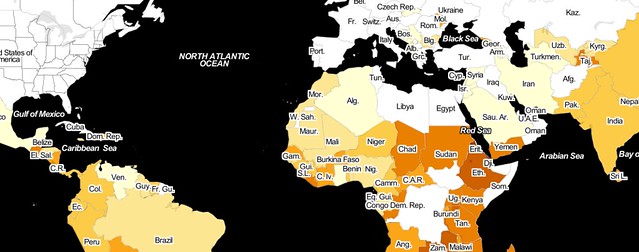
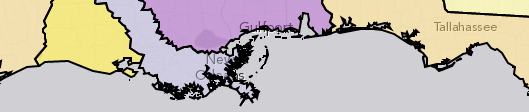
At the risk of beating a dead horse, I'm coming back to reference overlays. I've noticed that there a still a fair number of interactive maps online that permit a bullying thematic layer to stomp all over the poor, defenseless map labels and context information. This is not cool:


So I've hashed out the code for getting past this using five common basemap services:

Feel free to reuse them as you see fit. All but the Google example use Leaflet, but the z-index and canvas manipulation tactics are applicable to other APIs as well. If anyone wants to add adaptations for OpenLayers or whatnot I welcome pull requests. Also worth a note is that - in the leaflet examples - the thematic layer is rendered as vector from topojson, which is arguably the fastest vector format available to us today. Give it a shot as a thematic mapping tool.

Go forth and bring context back to your interactive maps!


Note: Thanks to Bobby Sudekum, Josh Livni and Jason Sanford for the starting blocks.

Read more ...

Crime Doesn't {{Insert Variable}}

Tuesday, September 17, 2013

tl;dr

There's no citywide relationship between crime rate and elevation in San Francisco. It's because there are other factors at work - like property value, income, tourism, etc. - in between the two. But there are a few discrete spots around the downtown area where it is at least partially accurate to say "Crime doesn't climb" - check out the last map on this page.


Crime Doesn't What?

Dammit, I love hexbins. I love their flow complexity, I love their visual appeal, I defend them where necessary, and I use them wherever I can. However, sometimes hexbins don't tell the whole story.

Last week a couple of talented Bay Area developers put some of San Francisco's new open data to use, testing the old adage that "Crime Doesn't Climb" in the city. They compiled SFPD crime statistics in elevation-based strata and found - indeed - that the lion's share of SanFranCrime occurs closest to sea level. Recognizing a bit of simplicity in this argument, they went a step further and adjusted the numbers to account for the fact that there is simply more space - more crime-canvas, if you will - at lower elevations. The results were the same: lots of crime low, not much up high.

The web reacted with characteristic nuance and reason:


While there's irony and sarcasm at work here, I think it would probably be a shame if even a handful of people now contented themselves with the certainty that criminals are lazy, or if some misguided readers resolved only to pass through SoMa in an armored car.

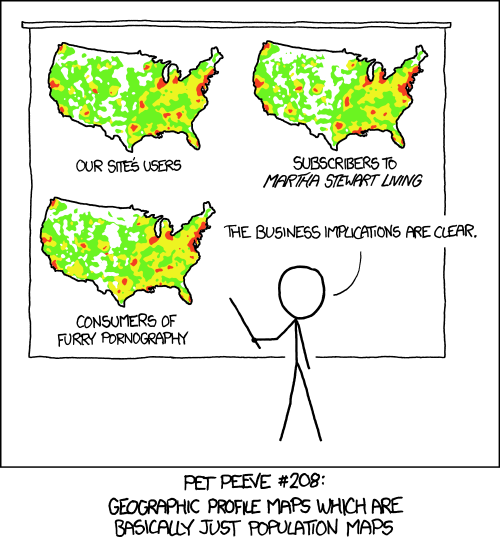
Because at it's heart, this analysis has already been critiqued by Randall Munroe:


Crime occurs where people - perpetrators and victims - are already concentrated. As such, any explanation of when/where/why has to account for population.

Population

The best level of detail available on population is the U.S. Census block. In a city as big as San Francisco, there are thousands of these, each with a very credible population count. They're not as spatially consistent as hexbins, but they're accurate:


Elevation

Elevation variation also contributes to the city's distinct character:


Crime

And the frequency of crime seems to reflect a bit of both population and elevation:


Read more ...

Open Cadastral Data: a Github Test Case

Wednesday, July 24, 2013

A bolt of GIS-Manna from Heaven

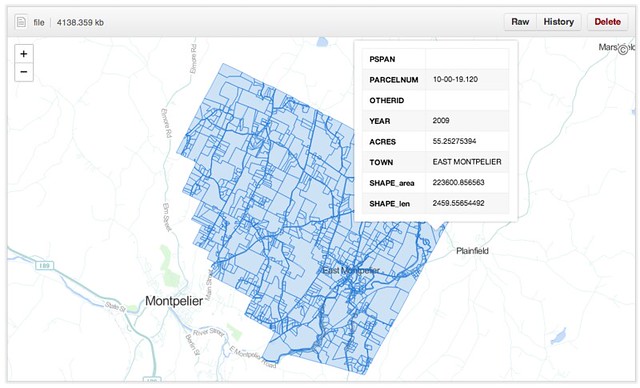
A dedicated and talented GIS developer at the VT Agency of Natural Resources just finished compiling the most-comprehensive cadastral dataset to which our small state has ever had access. Coincidentally he sent out the announcement while I was annoying a few githubbers about their new geodata capabilities. What luck: a test case.

The dataset - as a shapefile - clocks in at 250MB, representing 289,000 parcel polygons in 191 towns. [The 46 VT towns not included tend to have populations under 200 and a blithe commitment to dusty paper records.] It turns out that this is over the 100MB limit imposed on individual files, so I pulled the dataset, split it by town and converted the outputs to geojson, then pushed them to a repository I just set up. The largest of these is juuuuust over the maximum file size to be renderable in Github's snazzy new Mapbox-based interactive maps, but most of the town parcel maps pop up just fine.

The Implications

Okay, great - another slippy map somewhere on the web. Who cares? These folks, actually:
  • A landowner who wants to look up the parcel numbers of her abutting properties without visiting the steam pipe distribution venue in the basement of her local town hall.
  • A town GIS manager who has a hard drive overflowing with parcel shapefiles, converted CAD drawings and map requests from lawyers.
  • Probably a lot of lawyers. Don't get me started.    
  • The overworked data gurus at the Vermont Center for Geographic Information (VCGI), who - while they're probably the only agency that can handle it - are really reluctant to take on management of a statewide, rolling, versioned database.

What Github provides in this test case, for free:
  • Fast hosting of modestly-large geospatial data
  • Relatively-simple version control of said data
  • Edit access to anyone with a github account and a GIS platform (FOSS or Arc'ed)
  • An embeddable client view for the public for files up to 10MB
  • A robust API for client views bigger than that (for example)
  • A muthaflippin' download button (well, "save page as")
For those of us who have been ranting about geoportals in recent months, this pretty much covers the bases. For free. Github is walking the #opendata walk.


What's Next . . .

There are a whole bunch of caveats here. Biggest is the file size issue (though I've seen Bill Dollins and Sophia Parafina starting to work around that in the past few days), since 10MB is a fine limit for municipalities in the second-smallest state, but Manhattan is a teensy bit bigger. Another hitch is data quality; this dataset is top-of-the-line, but like any other it's missing SPAN numbers, dates and acreages here and there. The vendors will tell you that quality can't be beefed up in a free collaborative environment, without data value-add. I don't know if they're right or wrong.

But I'd love to see a town GIS manager throw a pull request and get this ball rolling. Who's up for it?

The data hub is waiting right here


Update: 7/25/13
I've heard a bunch of awesome questions about the practicalities of using Github this way, so while I am by no means a power user I recorded a quick demo video.
Read more ...