Pages

Showing posts with label Open Source. Show all posts

Redistricting: A Question and a Query

Wednesday, January 15, 2014
Alert: Both policy AND technology will be discussed below. Bring both your brains. You've been warned.
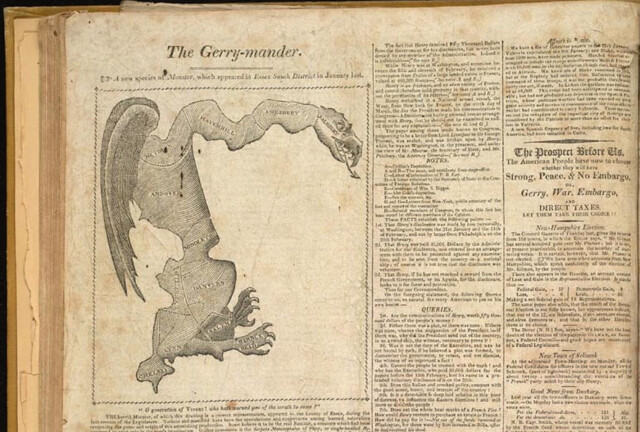
Gotta love the classics

The Question

My city is on the tail end of the country's redistricting cycle. Somehow while Texas was marginalizing Latinos and Dennis Kucinich was getting scribbled out of his constituency, we here in Burlington were waffling over how to deal with triparty politics and the implications of our changing neighborhoods.

I was unrealistic early on about how much of a role technology could play in the process. A survey of neighborhood geographic identity and a do-it-yourself redistricting app were helpful but not game-changing. After years of wrangling, the parties mostly just hashed it out in committee (though the final plan is derived from one made with our DistrictBuilder app), and now in about 6 weeks the voters will approve or reject it.

Which brings me to the question: What would the proposed plan change things for the average BTV citizen? It's a pretty easy one to answer in the aggregate - all the information is out there: new boundaries, old boundaries, population distribution, polling locations. But these bits are spread out across various sites and articles. What if there was a way to just ask the question: How will this change things for me?

Under the umbrella of CodeForBTV - the local CodeforAmerica brigade - I put together the basic answering tool. Built for phones (via Bootstrap), the app lets the user plug in their address and get back a list of redistricting plan implications:


The Query

The question of individual impact can be answered with a simple spatial query: return some pieces of information based on the polygons that intersect the user's location. This pointed to some basic building blocks:

  • The city redistricting plan - both the old wards and the new ones lumped into one geojson file
  • A robust search engine - I went with the Google Maps API because of the amazing viewport-biased geocoding and the built-in typeahead, but given more time I would use Leaflet and a state-hosted geocoder plus typeahead.js
  • Spatial query capability - fortunately CartoDB offers all the magic of PostGIS at a URL endpoint, with great styling available as well. 
The user-selected address gets converted to lat/lon, then sent to the CartoDB API in an ST_Intersects() query. It returns a map overlay of the old and new district boundaries at the site, and a set of answers to some FAQs about redistricting.

It's a simple app, relying on some robust APIs. I hope it's useful in getting my neighbors oriented to the landscape of the proposed redistricting. At the very least it'll save people some time peering at a large paper map in city hall, and at best it'll head off 40,000 individual "how will this affect me" emails directed at the city councilors and GIS manager.

I also hope it'll be of use to anyone else who wants to present geographic change over time at a user-selected location. Get the code on github.
Read more ...

How to build a Mobile-First Map Form

Friday, November 8, 2013

Find me, small screen.

I've spent a lot of time thinking about the incredibly rich experiences we're getting these days from a digital map paradigm basically invented by Google in 2005.

A rich experience everywhere but on mobile devices, that is.

The dichotomy is pretty intense - on our larger screens, we have data visualizations of artful grandeur. We have amazing cartography in tiles and vectors, and we have smooth analytical tools. We're even approaching "GIS on the Web" that doesn't suck.

But then you turn on your phone and the best applications use oblique-angle maps the same way they did in Car SatNavs a decade ago.

I don't have an answer to this problem, I just mean to say I've been thinking about it. And it turns out that a bunch of the technologies I use regularly can be pretty easily combined to offer some possible fixes for how a user experiences maps on mobile. I'll walk you through them while trying to tackle a basic application: a location-based survey.

1.) Bootstrap

I get it. I overuse Bootstrap for the architecture of my sites. But in the latest release (3.0) they went "Mobile First", so it makes many of my other tasks easy by providing the responsive classes out of the box:


2.) Google Forms

I still think of Google Forms as an underutilized gem for easy data collection: pipe data from a form to a spreadsheet with an API; one barely needs to try anymore :) However, tying a custom Bootstrap page to a specific google form requires a few things available in the source code of the input form's page:
  • Form identifiers:
  • Field-specific IDs:
  • A Redirection iframe:


3.) Mapbox.js

Most of the necessary functions here are actually native to Leaflet, but I like the look of the Mapbox implementation, and they provide "Retina Tiles" that scale better for mobile. The basic tasks for the map in this application are:
  • Figure out user location without asking
  • Let the user fix the inevitably-incorrect positioning
This works with a quick call to a free IP registry, centering the map on the result:


Then the user can drag the map around under the crosshair to where they actually are - this is a tactic I borrowed from OpenPlans after I got a reminder:


4.) CartoDB

Using a new tool they've made available to sync tables, there's almost no code involved in this step. All I needed to do was go to "File-->Publish" in the form target spreadsheet, then copy the .csv URL into the "New Table" creation dialog in CartoDB. Then a bit of easy styling created a custom-mapped results page:


The page itself is pretty simple, and you can grab it as a gist here. It'd be pretty easy to fork it and replace the form parameters with one of your own. As always, please share if you use it; I'd love to see where others take this.

The Caveats and Alternatives:

  • Geolocation by IP is pretty awful, unless you happen to be Google (but in that case you're currently being sued for the method by which you collected your registry). The service I used put me in the correct city on my laptop, the correct state on my tablet, but according to my phone I'm in Buffalo. There are better ways to get location, but they require user permission, which is a UX hurdle I didn't want to jump for this.
  • I subscribe to the gospel of responsive design because I'm lazy. It would probably be smoother to build this as a native Android/iOS app, but no way would it be this easy.
  • Since location is being passed to the table from the initial map, there's no geocoding and you could theoretically just tap the Google Drive API to put points on a results map. But again: EASY. CartoDB is that :)

#Facepalm

In the first run I forgot the mobile-specific meta tag. I was reminded :) Thanks, Vladimir!


Read more ...

Toward an Ideal Geoportal

Thursday, April 18, 2013

A Geoportal Identity Crisis

A city wants to open its geodata for public use. An NGO wants to spark a transparency initiative. A regional planning commission wants to stop emailing zipped shapefiles when pestered. They want to deliver two contrasting products - raw data and parsed themes - to as many as a dozen different audiences: policymakers, technical service providers, the press, professional curmudgeons, etc.

In the past decade, the solution to this nearly-impossible balancing act has been to build a Geoportal, and we've seen some pretty memorable misfires. Most of the trouble can be chalked up to the good intentions of the technicians who produce the data and the tools to distribute it; accustomed to a desktop GIS environment for exploration and analysis, they have built and re-built "GIS on the Web" (Chris Herwig documented his travels around a broad selection of them). They've done this under the assumption that users will be filtering, buffering, selecting by location and overlaying, and as it happens that's not really true. This approach fails all sectors of the public.

For many months now, Brian Timoney has been championing sanity in the wasteland of geoportals. He expertly trolls the mapjunk and the faustian UX, but he's also offered an analytics-based selection of "Best practices" for getting geodata to the public. Beyond how users actually interact with online maps, he's drawn attention to the subtle distinction between "open data" and "useable open data". But he is still something of a voice in the wilderness, as we all nod vigorously in agreement and go back to downloading file geodatabases from the USGS. We work with the system we have, because it's hard to envision the details of the alternative.

A Template

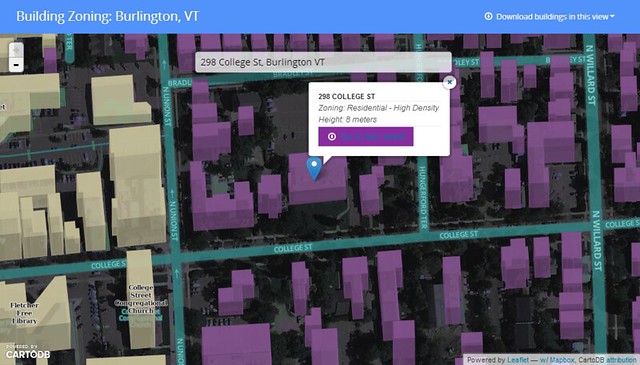
I've been trying to envision such an alternative, spurred on by some adventurous clients. Specifically, I wanted to see if it was possible to crack open a public dataset in a way that was compelling to technicians as well as to the lay public - something that would adhere to emerging best practices as well as to my own bias toward open architecture for open data. Timoney himself has already taken a stab at this, but we have different styles. So I cobbled together a template geoportal, wrapped around a standard multipurpose bit of public data: building records.

Give it a spin here.

I assumed two audiences: 1.) citizens who want their own zoning information and permit history fast, and 2.) analysts who want to grab bulk chunks of building footprint geodata for urban planning, disaster response or just noodling cartography. The former group can search for their address, see their building in context, and get the basic info before heading off to print their fact sheet. One minute or less.


The GIS specialists of the world can hit the download link and vacuum in all the features within the current view extent, in the interoperable format flavor that suits them (+TopoJSON for the bleeding-edge types).


This is just a page for a single dataset, but I think it meets the needs of both audiences and doesn't suck to look at or navigate. A few of the other features I wanted to include:
  • Lightweight and Javascript-based - less than 1MB before the tiles show up.
  • Shareable URLS - the root URL is subject specific, and the location hash allows users to pass around a focused view of a neighborhood or house.
  • Traditional search (in the hanging dialog box) is prominent without obscuring the map, since I'm of the opinion that a map is better as a page canvas than as a tiny sidebar window.
  • Very few visible bells and whistles - This is built to some narrow workflows with no mission creep and no toolbars. A bunch of info is socked away in a modal popup for the intrepid.
  • Cartography - I'm done with auto-pixelated graphics and bad default symbology; this is 2013 and we should all be using Mapnik for the web.
  • Open-source undercarriage - this is a combo of Bootstrap, Leaflet, CartoDB and Mapbox.
  • A note on CartoDB and Mapbox - their server code is legit open-source (meaning I could just run it my own damn self), but I've used their hosted services here since it's just - ack - easier to let them handle the services and flexibility thereof. And still cheaper than the competition. 
It's true that much of my requirements were about what to omit, but it is truly a difficult task to limit the scope of an application that is being driven to omni-functionality by stakeholders. Resistance is part of the process.

Here's the code on github. The index.html is commented liberally, so you should be able to tell where to swap things in and out. Scaling this approach to an entire suite of geodata could be as easy as forking the repo for every dataset you want to present to the public. Single-theme maps will see the most use in the long run, so keep it simple.

The To-Do List

This app needs typeahead in the search box to really deliver options. Andrew Hill at Vizzuality shows how easy this is when pulling from a CartoDB address column, but I'm still trying to bolt it onto the partially-abstracted leaflet geosearch module with my meager javascript skills. I will gleefully accept pull requests. Additionally, you may note that each building's "Fact Sheet" points to the same place. The city of Burlington is doing great things with its data, but we don't have building URLs keyed to parcel IDs or addresses yet :)

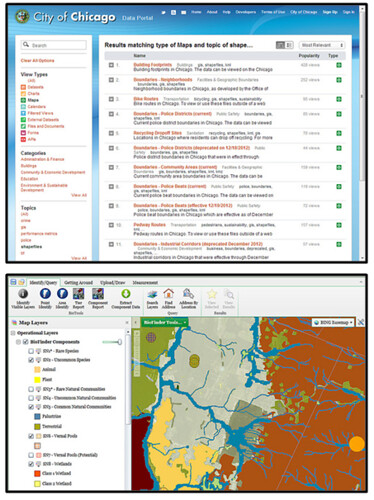
The bigger question is one of data discovery; if we're going to limit geoportals to one theme at a time, how do users get where they want to go? I hate being directed to a silverlight-slinging "Map Gallery" when I'm looking for info, but I'm not sure what the alternative is for top-level geodata search. Is it Chicago's spare text-based search? Is it the 300-button web GIS that requires training to use? Is it good SEO?

We know something about how users behave once they find the map they want, but how do we get them there in the first place?

Listocracy from Chicago, GIS-in-a-browser from VT Nat. Resources
Many thanks to Jay Appleton from the city of Burlington for being the single-handed support structure of open data here, including emailing the occasional zipped shapefile :)


Read more ...

VoteMapping

Tuesday, November 6, 2012
The big day is upon us again, and since my vote in the people's republic of Vermont (The GOP's term, not mine) doesn't really matter, I've turned my attention to the national level. First, to the many controversial things appearing on Twitter:


Well, turns out when you cast a broad net people are actually saying some pretty hideous things on Twitter. This app I knocked together a few months ago from a Mapbox template reveals the tweeting public in all its grammar-deficient, race-baiting, socialism-misdefining glory. I stopped watching it after the last debate, since it was damaging my faith in humanity:


It'll be more interesting to see if any of the many "Election Crowdsourcing" apps produce robust datasets about the differences in voting experience around the country. Twitter is too hard to mine for precinct-specific context about wait times at polling places (Don't believe me? Give it a try.), so I'm hoping to see some useful information from MyFairElection and Mother Jones.

If you note others who are collecting such info, please drop me a line in the comments or on Twitter (@vtcraghead). Because this is my mapping project for the today if I can get enough data:

Read more ...

The Official Takeover

Wednesday, August 29, 2012
High Seas by AJ Ashton. Pirate by Lego, clearly.
ESRI has made some interesting moves in the web mapping space in the past year. I don't blame them for being desperate to get a grappling hook up on a ship dominated by a combination of Google Maps and an open-source polyglot, but at this point the attitude is starting to border on dickish:

  • Step 1: ESRI rumbles toward a unified way of getting licenseholders' data online, while pulling a group of early innovators - GeoIQ - onboard to help. Admirable.
  • Step 2: ESRI adopts the term "Web Map" along with "Story Map" and a few other items that they clearly stole. No worries; a bit of rebranding and we're all one big-happy-web-mappy family, ESRI, Google, FOSS4G and your grandmother with her Bing API side project.
  • Step 3: ESRI kicks everyone else off the boat they just boarded. Now only ESRI makes "official" web maps, and clients should be wary of cut-rate imitators. Specifically a "Web Service" is only an ESRI REST service, and a "Web Map" is "[Like an] .mxd file, but for the web." 
Okay, this is an oversimplification - particularly that step 3 doesn't come from ESRI directly, but from a well-intentioned partner. Well-intentioned because the author clearly wants the "Average GIS professional" to have access to the brave new world of the cartointerwebs and that path is not currently an easy one. But this attitude doesn't arrive in a vacuum; ESRI has cultivated it in the hope that no one will notice they didn't innovate the web mapping space. Web developers did and still do. Folks from tiny open-source shops all the way up to search giants.

Fair play to the big guy with the marketing budget, you say. But here's why I want the developers that built this ship to retain control of it: THEY'RE BETTER AT IT. The user experience is uniformly superior in non-ESRI web maps, the implementation costs are lower and the data is faster. Though this will change and ESRI will catch up if new hires like Sean Gorman have anything to say about it.

But for now I would love to see a bit of humility and willingness to listen on the part of the GIS giant, instead of taking the ship by storm and kicking off everyone who knows how to steer it.
Read more ...

Results of the Geo Toolkit Poll 2012

Monday, July 23, 2012
Many thanks to everyone who participated in this survey of the geospatial industry. I tried to get a platform-agnostic look at the tools that are most-frequently used in our community, and after 250 responses I think we have a useful glimpse of the scene.

My reason for running this survey: I'm tired of speculating. As a multi-platform user I don't know where I stand with my clients and competitors, let alone in this sprawling industry, and I've heard lots of similar curiosity from colleagues. I call this an independent survey in that no vendor funded it (nobody funded it, actually) and it isn't for marketing use. This is a community poll, nothing more. Onward . . .

Methods

This is worth a cursory glance, since the results are inevitably colored by the collection routine. I relied almost entirely on social media to get the word out, specifically:
  • Numerous twitter solicitations to my ~500 followers, retweeted to a combined audience of over 11,000 utilizing hashtags for both the ESRI User Conference and OSCon - probably annoying the crap out of everyone in the process
  • Google+ and Facebook posts
  • Listserv posts to ESRI, OSGeo, OSM and Google user groups
  • Posts on the three largest geospatial groups on LinkedIn
Given the warren-like distribution network, I do not know how many people saw this poll. Thus the sample size is 250 out of an unknown population, and no big-picture conclusions should be drawn. Also let it be known that the balance - even if measured properly - changes from month-to-month.

Results


Question 1: Which of the following geospatial technologies have you used on at least one project in the past year? [Note - I Included pre-purchase GeoCommons on its own out of morbid curiosity; I otherwise would have included it with FOSS4G Web Tools]

Some of the technologies that went into the "Other" column include FME, MicroStation, ENVI/IDL, GIS Cloud, AutoDesk, Maptitude, Idrisi, ERDAS, MapProxy, R-Spatial, Garmin Basecamp, Oracle XE, Ushahidi and Geocortex. Sorry to have ignored those, but it's a big ecosystem out there.


Question 2: Which of the above technologies did you use most frequently in the past year?


Platform Gregariousness: Do you cross over from your primary platform? e.g. ESRI is your main platform but you've also used Google Maps/Earth at least once in the past year. [A venn diagram would be cooler but the chart API was inscrutable]


Use by Business Sector:


Use by Country: (Click here for fullscreen glory - we're all cartographers here)


There's a lot to see in these distributions - an ESRI lean among U.S. respondents, a FOSS4G lean among Europeans. Also interesting to see how the sectors use these tools. See anything of note? Anything obviously-spurious? Do tell - I think there's a good discussion to be had here.

I'll say it again: this was not a scientific, controlled survey. It's a snapshot or an anectodal collection; take your pick. But it is nonetheless interesting to see what this group of mappers uses to get the job done. Thanks again to you all for pitching in, and maybe we'll try an expanded version next year.

If you're interested in the raw, messy results (stripped of unique identifiers of course), hit this link for an XLS download, and happy parsing!


Read more ...

Results of the Geospatial Technology Users' Poll 2012

Friday, July 20, 2012
Update 7/23/12:  The poll is now reopened and live results are appearing at a new post. The figures and discussion below should be considered preliminary

Thanks to all those who hit yesterday's poll of technologies at work in the geospatial field. I've got some interesting results below.

First a note on experimental design: This crap is not scientific. First I tweeted, facebook-posted and Google+'d, so I got in contact with the core community of geogeeks with whom I regularly interact. Then I sent it out via the Vermont GIS listserv, the ESRI user conference hashtag and the O'Reilly open-source conference hashtag, hoping for balance. There is surely a geographic skew toward the U.S. Northeast, but I'm pleased with the general distribution of respondents. n = 117, which seems pretty good to me. Hit me on Twitter or on the GeoSprocket contact page if you'd like a copy of the raw survey results.

Here's a look at the participants using the generalized locations of reported companies/institutions (lots were left blank, so who knows):


The results of question 1:

Note: Some of the technologies that went into the "Other" column include FME, MicroStation, ENVI/IDL, GIS Cloud, AutoDesk, Maptitude, Idrisi, Mapserver and Geocortex. Sorry to have ignored those, but it's a big ecosystem out there.

And the results of question 2:
Ayup, ESRI Desktop is the big winner in this circle. But a surprising number of Google Maps folks there too. Also intriguing is the even split among the open-source toolset types, contrasting with the topheavy ESRI lean toward desktop.

Here is primary toolset use by overarching category:


Things get interesting when we parse out some conditional results:
  • 40% of users whose primary tool is an ESRI product have also used an open-source geo platform in the past year.
  • But a whopping 80% of users whose primary tool is open-source (desktop, web or DB) have also used an ESRI product in the past year.
  • Same with Google - 80% of respondents who primarily use Google Maps have also used an ESRI product in the past year.
  • That favor is largely returned - 75% of primary-ESRI users have used Google Maps.
  • OpenStreetmap and GeoCommons had plenty of casual users, but very few used them/built them as their primary tool (1% each).
      There's a venn diagram to be had in there somewhere, but I'm not up to it.

Without leaping to conclusions, I would say that it's still an ESRI world. Even the folks whose day-to-day revolves around open-source or Google tools still fire up an Arc license every now and then. The converse is not equivalent; fewer than half of ArcJockeys use any of the open-source tools, though they are partial to Google Maps.

There are a lot of potential reasons for that, but it seems safe to say that open-source geo is still developers' territory, and Google mapmaking tools are more comfortable ground for ESRI's users. I recall that specific path when I was making my own way from ArcGIS to GDAL and Javascript.

There's a lot to read here; what are your thoughts? Anything surprising?


Read more ...

Open Source, Open Data, Open For Business.

Tuesday, July 10, 2012
GeoIQ and an Origin Tale


In 2009 I was a "GIS Technician". Heaven help me, I was auto-completing polygons on good days and schema locking on bad ones, at a well-meaning but projection-free engineering firm with 300 AutoDesk licenses and 5 ArcEditor seats. It was the worst of times.

Early on that year I took a week off to go to Las Vegas with my wife, who was presenting at the AAG conference there (she's the brains of the outfit). Benefiting from the super-low "Spouse" attendance fee (academic geographers take note), I wandered from one cool session to another, my brain stimulated in new and exciting ways. I watched in a standing-room only crowd as Jack Dangermond explained how mashups (remember those?) were going to solve Africa's problems, and I saw my first demonstrations of Object-Oriented Image Analysis and Hyperspectral wetlands detection. Cool enough, but there was something disheartening about the fact that 95% of the map crunching I saw was being done by ESRI products.

On a whim, I went to a panel session called "Open Source GIS". Probably for the damn novelty of it, but also maybe due to some lingering frustration from being license-bound while trying to do mapping work in my peace corps years. The little room was about 3/4 full and the panel consisted of some folks from USGS who used GRASS and PostGIS, and also an animated fellow named Andrew Turner from FortiusOne, who had a few things to say.

The Open Source GIS Panel at AAG 2009. Note the overdressed gentleman about to drop some science on us. (Photo courtesy of  Shriram  Ilavajhala)
It was no great conversion moment. The session covered some pretty wonky stuff from the perspective of a button-clicking non-coder, though the enthusiasm was palpable in the audience. The real "Glitch in the Matrix" hit when I talked with Andrew after the session. In an information stream that challenged the human limits of spoken words per minute, he told me it might be helpful if I downloaded Quantum GIS (1.3, yo.) and took a look at GeoCommons.com. Back at my computer, the world opened up to me; this was the starting event that would lead to the creation of Geosprocket a year later, and for that I am eternally grateful.

An early, misguided attempt to use GeoCommons in mapping global coffee production. Things have gotten better.
In that session and in subsequent interactions, Andrew conveyed two motivations for his work with FortiusOne-thence-GeoIQ.
  1. Open Source: OS software is just the tip of the iceberg. It fosters a culture of innovation and robustly supports the tools that people want most.
  2. Open Data: Geographic information should be a public good (Geo"Commons" - Get it?), and we can all benefit from driving maps into the public sphere.
These drivers were not unique to GeoIQ; they are dear to many in our community. Over time I have adopted these and included them in the core of Geosprocket's mission. As such it was something of a body blow this morning to read the news that GeoIQ had been purchased by ESRI. The pundits have already weighed in eloquently on this deal, and I can't add any new market analysis. I've even run out of snark. I can only mourn a bit to see GeoIQ forced to choose between open source and open data, for they have surely chosen the latter.

I have no doubt that ESRI's resources will supercharge GeoIQ's pursuit of open data. If Jack and co. have the wisdom to scrap ArcGIS Online and replace it with "ArcIQ" the world will be a better-informed place. But I'm going to miss the code contributions of some talented individuals. I raise a glass to them for getting me started in this business.


Read more ...