Pages

Showing posts with label OpenStreetmap. Show all posts

On Reverse-Engineering a Map Stack

Saturday, January 11, 2014


I'm going to come right out and say this:

You should probably just use Mapbox.

How I came to that conclusion is a bit of a longer story.

The Scene

As a cartographer, I am an unabashed fan of Mapbox. I've been using Tilemill for years, and I love the fully-realized design of the Mapbox Streets basemaps. Even before Google Maps brought the paywall hammer down I was already migrating my clients' projects to the open-source ecosystem based out of a D.C. garage. Controlling so much of the stack in an open-source environment meant less risk to my clients, and in most cases it came out a lot cheaper. The choice was pretty easy, actually. 

Looking around this section of the market I don't believe that Mapbox and Google Maps have anyone to compete with but each other (mobile is another story). They are the only two companies currently offering a rigorous javascript API tightly integrated with attractive map services built for the web. (Debate this in the comments, ESRI, Nokia, and Bing users) There are plenty of a la carte options out there - Stamen's wonderful map tiles, the sheer power of the OpenLayers API - but as a lazy developer I've come to really like working with an integrated, open stack. Mapbox is my current choice, though many use cases all but require Google's services.

The Challenge

An open-source stack doesn't mean a free stack, and Mapbox's map tile charges can rack up quickly if you're not paying attention. Exhibit A: I offered Brandon Martin-Anderson one of my Mapbox tilesets to use as a reference for his Census Dotmap. Several viral weeks later I was looking at overages the size of my annual budget.

An open-source stack may not always be free, but in theory it can be copied and hosted by others. I've done this quite a bit on the javascript API side, mixing and matching tile providers with various client libraries. However, the costs that had begun to concern me were on the basemap end. So I set out to do what Mapbox flat-out encourages you to do with its wide-open codebase:

I would make and serve my own damn basemap. How hard could it be?

The Tools


I started with the open-source Tilemill template OSM-Bright, noting that there are some good examples of it in use out there. I grabbed the current OSM data, piped it into my local PostGIS database (note the hazards of adding many extracts) and spent some time turning it into "Geosprocket-Bright" in Tilemill:
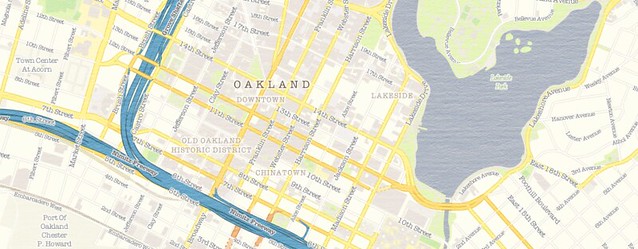

Next came the heavy lifting. I exported a slew of regions to .mbtiles format; I would have loved to build a map of the entire world down to street zoom level, but I thought I'd start more realistically with a global map down to zoom level 9, then a handful of cities down to zoom level 17. I planned to put them on an Amazon S3 instance and tap them directly from the client library, doing an end-run around Mapbox hosting. Sounds pretty smooth, right?

Let's keep track of the time investment, shall we?

  • 4 hours to export everything from Tilemill
  • 6 hours to chop the .mbtiles into 1.6 million PNGs
  • 3 hours to consolidate them all into a single directory structure (because I was too dumb to do that in the last step)
  • 56 hours to push the tiles to an S3 bucket on a 20mbps connection
Obviously these are CPU hours, not billable hours - but it was still more than two days between when my map style was ready and when I could actually hook the map up to a browser.


The Verdict

This is a narrow case where I needed to roll my own tiles and serve them. My map included texture and custom fonts, which is beyond the reach of Mapbox Streets. The total filesize of my exports - even as .mbtiles - was 15GB; that translates to the Premium Mapbox hosting plan, and a whopping $6,000 flat fee per year. That's for five cities - the tiniest fraction of a world of tiles. It's not quite Google Maps Enterprise money, but damn. By contrast, it cost me nine bucks to get all of my map tiles into an S3 bucket, where I'll get billed something like half a cent per 1,000 map views.

But this process will be moot pretty soon anyway; the promise of Tilemill 2 is that you only need to bring your cartography to the table - Mapbox will do the rest of the work to get your style to the browser with vector tiles. They've only done this for a few testers while they're hashing out the details, but odds are there will be a public version in the first half of 2014. 

In keeping with other examples of open-source underpinning software-as-a-service, Mapbox has a sound business model. Despite the huge amount of intellectual capital they've open-sourced, it is still easier and - when time spent is considered - VASTLY cheaper to just use their hosted map services. I suspect they've been totally aware of this even as they release service-liberating tools like Tilemill, OSM-Bright and mbutil. The scale and efficiency of Mapbox make their hosted maps too good to avoid.

I hope my experience here has been instructive to others.

The Product

I did get a map out of my experiment, and it's free to use. If you happen to be mapping in Warsaw, Sochi, Santo Domingo, LA or the Bay Area, I hope it proves useful. Just use this XYZ tile scheme in your client implementation:

http://s3.amazonaws.com/geosprocket/tiles/{z}/{x}/{y}.png

As per the usual OSM license, be sure to include "© OpenStreetMap contributors". Happy Mapping!

Read more ...

Tiled Basemaps Survey 2013 - Results!

Tuesday, August 6, 2013
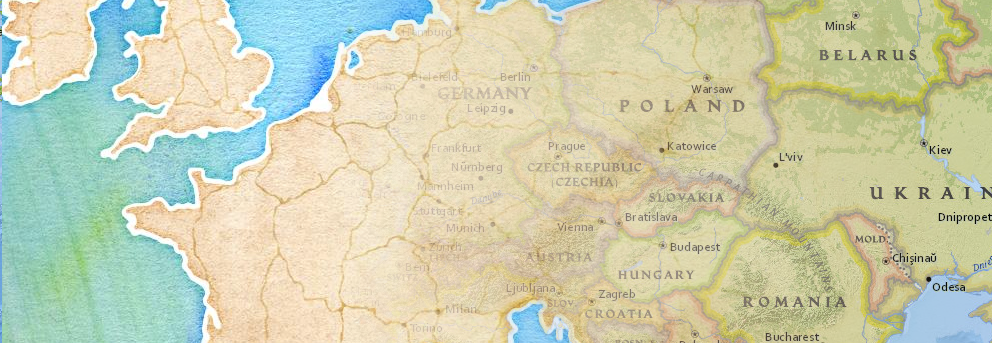
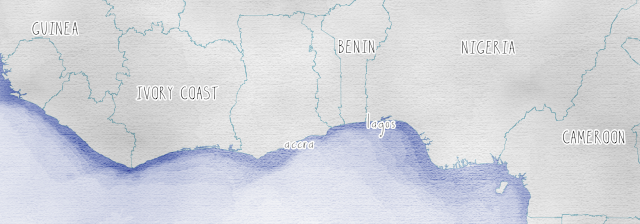
From Stamen, OSM Contributors and National Geographic

The results are in!

123 helpful participants submitted their thoughts on their favorite basemap services, and without further ado I present some of the results:

Which tiled basemap is most cartographically appealing to you?


Google, National Geographic (served via ESRI), and Mapbox are the winners here, with support for Stamen's options as well. "Other" in this case included OSU's Crinkled Watercolor and OpenCycleMap. Between the Stamen, OSM-Mapnik and Mapbox selections here, tiles based on OpenStreetmap data were ahead of the others. But this is a popularity contest based on looks. Moving on to substance . . .

Which tiled basemap do you use most frequently in your projects?

Google wins on ubiquity. Almost half of the respondent pool uses Google's tiles first; though given the widespread adoption of the API this is not a great surprise. More interesting is that about half of these Google users find a different basemap to be more attractive. Which brings us to . . .

What factors drive the choice of basemap for your projects?


Respondents could choose more than one here, but it's clear that not many balked at the technical challenge or vendor lock-in concerns. Mostly it seems like choices were driven by a balance between aesthetics and quality/detail, with cost and licensing hovering in the back of respondents' minds.

What do you like best about your "cartographic favorite"?

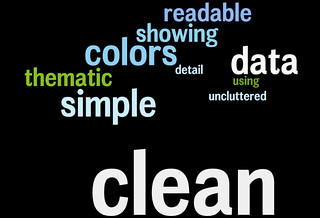
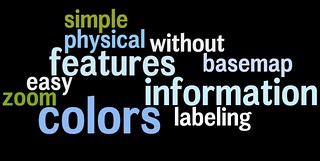
Unpacking these results is best done with a series of [gasp!] word clouds for the top three choices. You might call it a word storm . . .

National Geographic: 

Mapbox: 

Google: 

Interpret these as you will - subjective assessments have a way of bleeding from one choice to another. For instance, it looks like everyone likes the "colors".

Whoa there . . .

This is not a scientific survey. And despite my best efforts to reach out to all the communities involved, it's probably not even terribly representative. But it's interesting to inspect the choices made by this particular group of mappers, and fantastic that so many were willing to share their thoughts. Check out the unvarnished results here - mostly interesting to see the full explanations of what folks like about their preferred aesthetic.

As always, drop me a line if you have any questions or concerns about these results. Thanks to all who participated!


Read more ...

Tiled Basemaps: the Survey

Monday, July 8, 2013


The time has come once again for a taking of the geopulse! In years past I've asked broad questions about platform-level technology use, but this year I'm getting more specific:


Yes, I realize that the very concept of tiles is about to go the way of the Avenue script, but the present moment is still flush with amazing cartography served up in square chunks. For this survey I've chosen a selection of "Streetmap" styles from the major players, since imagery is another can of worms entirely.

I've built a comparison app here (with thanks to Dair Grant for the idea). Check it out and vote for your favorite.

Note: It's not possible to get a perfect comparison, since some maps tiles are locked to a particular API (what up, Apple), and others were too hard to parse into a single web map (Was a quadkey scheme really necessary, Bing?). Feel free to add these in if they serve as your go-to basemaps anyway.

Thanks for participating, and check back here for results in a few weeks!
Read more ...

Taking Tilemill 2 for a Spin

Sunday, May 19, 2013

When I took my first GIS class, I was told that 5% of my time would be spent making maps, while 90% of it would be spent corralling data into usable format and 5% would be spent beating an unresponsive plotter with a cardboard tube. This balance has definitely changed as interoperability has gone from prayer to practice, but I've continued to be frustrated by the time I feel gets lost to a missing shapefile extension or a falsely-defined projection.

For all the fun afforded us by Mapbox's original Tilemill map design platform, it's always been sort of a GIS-y hassle to wrangle data into it. Mind you this is slight, glancing criticism - it's NOTHING compared to getting your geodata to work in Illustrator or any actual GIS platform. But I always found myself wishing I could spend less time racking my brain for where I put that awesome building footprint layer, or trying in vain to find the right ORDER BY syntax for a PostGIS datasource.

Perhaps you've heard, but Mapbox sort of solved my whiny problems. Tilemill 2 is in unsupported alpha, but it's already fulfilling my dream of data-agnostic cartography. The basic idea is that the world - as derived from OpenStreetmap - is some pretty centralizable basedata, so why not just tap the source and style it however you like? Instead of pulling extracts or copies or subsets, Tilemill 2 just gives you the whole damn world, all 330GB-and-counting of it, via super-fast vector tiles (great explanation here). You get to style those tiles with the CartoCSS language, and at that point they're ready for your audience.

It is A LOT of fun to have the world at your fingertips:


For the moment there's no export or serving option, and it'll be interesting to see what Mapbox does with this tool in its already-robust custom mapping lineup. It's also worth noting that planet.osm is not ALL TEH DATAZ - we'll always need a way to use local or personal geodata. But this is a great leap for an already-impressive platform.

It's liberating to be able to focus on cartography with the building blocks already in place.


Props to Gretchen Peterson for some great color ideas as I fiddle with this.


Read more ...

Results of the Geo Toolkit Poll 2012

Monday, July 23, 2012
Many thanks to everyone who participated in this survey of the geospatial industry. I tried to get a platform-agnostic look at the tools that are most-frequently used in our community, and after 250 responses I think we have a useful glimpse of the scene.

My reason for running this survey: I'm tired of speculating. As a multi-platform user I don't know where I stand with my clients and competitors, let alone in this sprawling industry, and I've heard lots of similar curiosity from colleagues. I call this an independent survey in that no vendor funded it (nobody funded it, actually) and it isn't for marketing use. This is a community poll, nothing more. Onward . . .

Methods

This is worth a cursory glance, since the results are inevitably colored by the collection routine. I relied almost entirely on social media to get the word out, specifically:
  • Numerous twitter solicitations to my ~500 followers, retweeted to a combined audience of over 11,000 utilizing hashtags for both the ESRI User Conference and OSCon - probably annoying the crap out of everyone in the process
  • Google+ and Facebook posts
  • Listserv posts to ESRI, OSGeo, OSM and Google user groups
  • Posts on the three largest geospatial groups on LinkedIn
Given the warren-like distribution network, I do not know how many people saw this poll. Thus the sample size is 250 out of an unknown population, and no big-picture conclusions should be drawn. Also let it be known that the balance - even if measured properly - changes from month-to-month.

Results


Question 1: Which of the following geospatial technologies have you used on at least one project in the past year? [Note - I Included pre-purchase GeoCommons on its own out of morbid curiosity; I otherwise would have included it with FOSS4G Web Tools]

Some of the technologies that went into the "Other" column include FME, MicroStation, ENVI/IDL, GIS Cloud, AutoDesk, Maptitude, Idrisi, ERDAS, MapProxy, R-Spatial, Garmin Basecamp, Oracle XE, Ushahidi and Geocortex. Sorry to have ignored those, but it's a big ecosystem out there.


Question 2: Which of the above technologies did you use most frequently in the past year?


Platform Gregariousness: Do you cross over from your primary platform? e.g. ESRI is your main platform but you've also used Google Maps/Earth at least once in the past year. [A venn diagram would be cooler but the chart API was inscrutable]


Use by Business Sector:


Use by Country: (Click here for fullscreen glory - we're all cartographers here)


There's a lot to see in these distributions - an ESRI lean among U.S. respondents, a FOSS4G lean among Europeans. Also interesting to see how the sectors use these tools. See anything of note? Anything obviously-spurious? Do tell - I think there's a good discussion to be had here.

I'll say it again: this was not a scientific, controlled survey. It's a snapshot or an anectodal collection; take your pick. But it is nonetheless interesting to see what this group of mappers uses to get the job done. Thanks again to you all for pitching in, and maybe we'll try an expanded version next year.

If you're interested in the raw, messy results (stripped of unique identifiers of course), hit this link for an XLS download, and happy parsing!


Read more ...

GeoTools 2012 Poll - Round 2

Monday, July 23, 2012
Expanding the search around the Geo Community:

Read more ...

Results of the Geospatial Technology Users' Poll 2012

Friday, July 20, 2012
Update 7/23/12:  The poll is now reopened and live results are appearing at a new post. The figures and discussion below should be considered preliminary

Thanks to all those who hit yesterday's poll of technologies at work in the geospatial field. I've got some interesting results below.

First a note on experimental design: This crap is not scientific. First I tweeted, facebook-posted and Google+'d, so I got in contact with the core community of geogeeks with whom I regularly interact. Then I sent it out via the Vermont GIS listserv, the ESRI user conference hashtag and the O'Reilly open-source conference hashtag, hoping for balance. There is surely a geographic skew toward the U.S. Northeast, but I'm pleased with the general distribution of respondents. n = 117, which seems pretty good to me. Hit me on Twitter or on the GeoSprocket contact page if you'd like a copy of the raw survey results.

Here's a look at the participants using the generalized locations of reported companies/institutions (lots were left blank, so who knows):


The results of question 1:

Note: Some of the technologies that went into the "Other" column include FME, MicroStation, ENVI/IDL, GIS Cloud, AutoDesk, Maptitude, Idrisi, Mapserver and Geocortex. Sorry to have ignored those, but it's a big ecosystem out there.

And the results of question 2:
Ayup, ESRI Desktop is the big winner in this circle. But a surprising number of Google Maps folks there too. Also intriguing is the even split among the open-source toolset types, contrasting with the topheavy ESRI lean toward desktop.

Here is primary toolset use by overarching category:


Things get interesting when we parse out some conditional results:
  • 40% of users whose primary tool is an ESRI product have also used an open-source geo platform in the past year.
  • But a whopping 80% of users whose primary tool is open-source (desktop, web or DB) have also used an ESRI product in the past year.
  • Same with Google - 80% of respondents who primarily use Google Maps have also used an ESRI product in the past year.
  • That favor is largely returned - 75% of primary-ESRI users have used Google Maps.
  • OpenStreetmap and GeoCommons had plenty of casual users, but very few used them/built them as their primary tool (1% each).
      There's a venn diagram to be had in there somewhere, but I'm not up to it.

Without leaping to conclusions, I would say that it's still an ESRI world. Even the folks whose day-to-day revolves around open-source or Google tools still fire up an Arc license every now and then. The converse is not equivalent; fewer than half of ArcJockeys use any of the open-source tools, though they are partial to Google Maps.

There are a lot of potential reasons for that, but it seems safe to say that open-source geo is still developers' territory, and Google mapmaking tools are more comfortable ground for ESRI's users. I recall that specific path when I was making my own way from ArcGIS to GDAL and Javascript.

There's a lot to read here; what are your thoughts? Anything surprising?


Read more ...